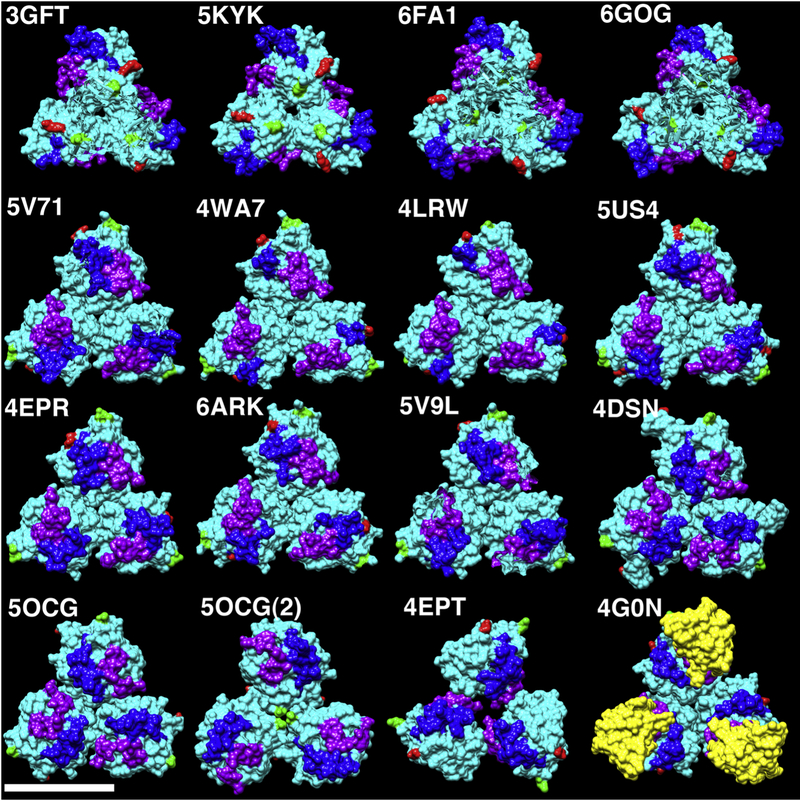
Figure 5. Comparison of RAS protein trimers.
Globular RAS protein trimers extracted from the unit cells of the indicated PDB files are depicted as solid cyan surfaces. N-terminal residues are colored green, C-terminal residues are colored red, switch I residues are colored purple, and switch II residues are colored blue. The bottom right structure (4G0N) derives from the crystal structure of wild type HRAS-GppNHp bound to the RBD of Raf (colored in yellow). All others derive from crystal structures of KRAS4B reported in multiple publications representing six different 3D crystal space groups as described in the Methods section. The size bar (bottom left) indicates 50Å. Note that 5OCG and 5OCG(2) are two different trimer forms corresponding respectively to 5OCG unit cell chains 4–6 and 1–3. Due to similarities in trimer packing, we refer to the top row as representative of trimer type A, the second and third rows (plus 5OCG) as trimer type B, 5OCG(2) as C, and 4EPT as D.

