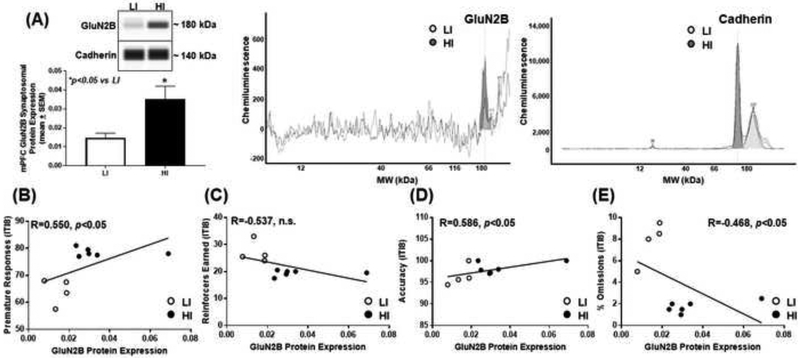
Figure 4. High trait motor impulsivity corresponds to higher GluN2B expression and correlates with additional measures from the 1-CSRT task.
(A) HI rats exhibit higher GluN2B versus LI rat (*p<0.05 vs. LI). Virtual blot-like representative images generated directly from the chemiluminescent signal for the GluN2B and cadherin loading control were performed using crude synaptosomal protein from the mPFC (inset). The corresponding electropherograms with chemiluminescent signals for GluN2B and cadherin represents HI (dark grey) and LI (light grey) rats. Correlational analyses between (B) premature responses (R=0.550; p<0.05), (C) reinforcers earned (R=−0.537; n.s.), (D) accuracy (R=0.586; p<0.05) and (E) percent omissions (R=−0.468; n.s.) and GluN2B protein expression.

