Fig. 2.

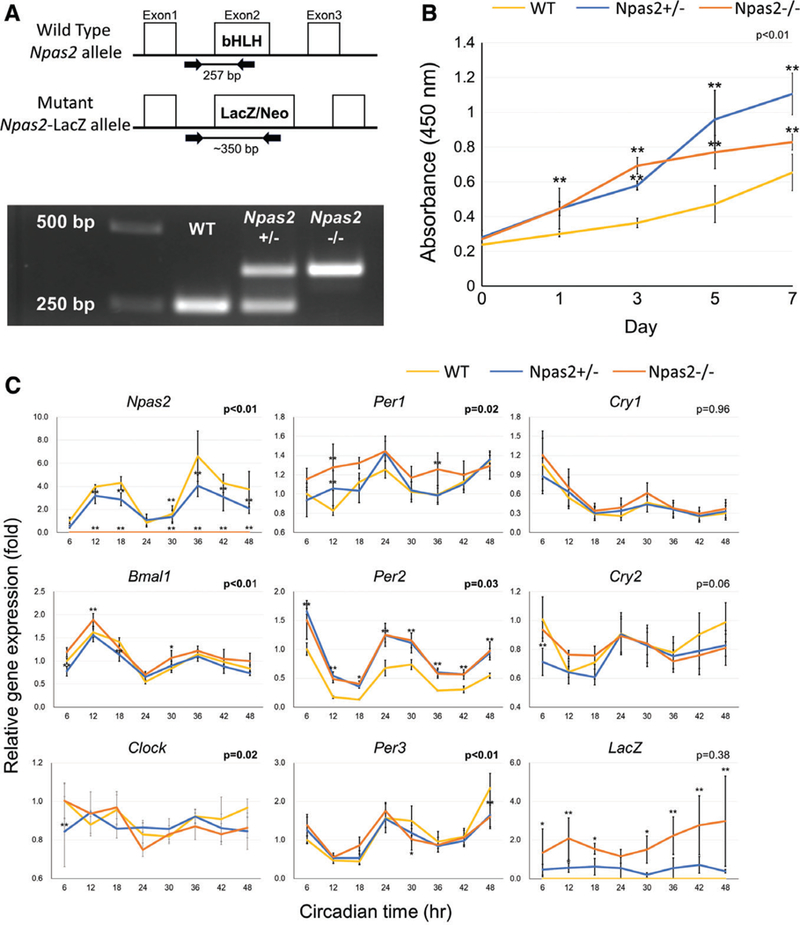
Characterization of WT, Npas2+/−, and Npas2−/− skin fibroblasts. (A) The genotype of each fibroblast batch was determined by genomic DNA PCR. The WT Npas2 allele generated a 250 bp PCR product, whereas the mutant allele generated a 350 bp PCR product. (B) The WST-1 assay demonstrated the increased cell proliferation rate in Npas2 KO fibroblasts (**P < 0.01, significant difference compared with WT at the time points via the Tukey analysis). (C) The expression of core clock genes and the LacZ reporter gene was determined by RT-PCR every 6 for 48 hr (P value in the figure: two-way ANOVA for the interaction between the time and genotype factors. *P < 0.05, **P < 0.01, significant difference compared with WT at the time points via the Tukey analysis) (C).
