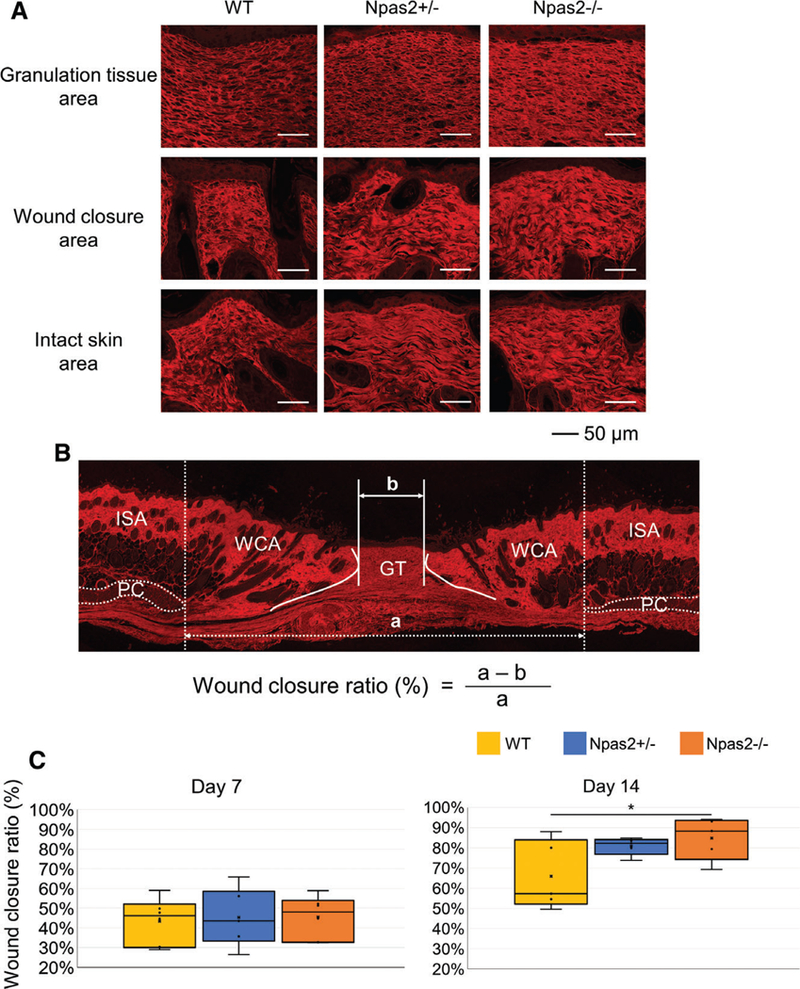
Fig. 5.

Evaluation of collagen fiber structure in the wound healing area. (A) Confocal laser scanning microscopy depicted the collagen fiber architecture stained with picrosirius red at 14 days after surgery. (B) Measurement of the wound closure ratio using the wound closure area (WCA) calculated as the width of the ISA (a) between panniculus carnosus (PC) subtracted by the granulation tissue area (GT: b), which was normalized by ISA. (C) The wound closure ratio was greater in Npas2+/− and Npas2−/− mice at Day 14, albeit statistical significance was achieved only between the WT and Npas2−/− groups.
