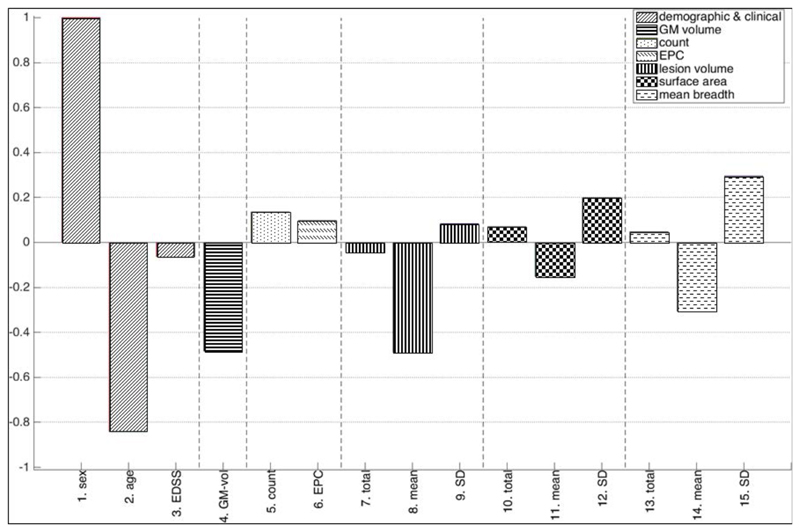
Figure 5.
M9. Individual weights from a linear SVM trained on demographic, clinical, grey matter volume and geometry based features derived from T1-Gd MRI data of IFN-b treated patients (converters: 50, non-converters: 49). Positive (negative) weights indicate that a larger feature value will drive prediction towards conversion (non-conversion). For sex, being female (male) corresponds to the positive (negative) axis. Weights are scaled relatively to the largest individual weight, which is set equal to one. Note that weights should only be interpreted qualitatively, not quantitatively.
Abbreviations: EDSS - expanded disability status scale, EPC - Euler-Poincare characteristic, GM - grey matter, SD – standard deviation.

