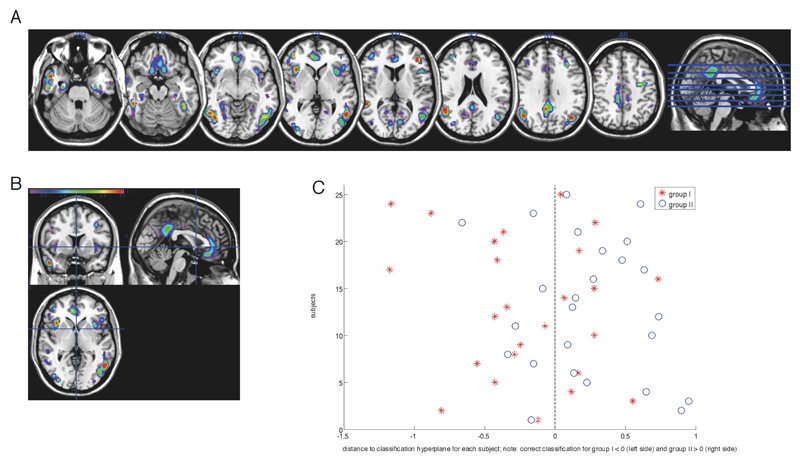
Figure 7.
Weight vector maps showing the most discriminating brain regions between placebo groups for the matched placebo groups (top 10 %; accuracy 66%). (A, B) Regions that contributed most to classification accuracy in the matched placebo groups are shown in red, in axial, coronal and sagittal views (z = [-28, -18, -8, 2, 10, 22, 31]). (C) Projection of each subject onto the weight vector; with positive patterns (blue circles) discriminating for conv+, and negative patterns (red crosses) discriminating for conv-CDMS could not be predicted based on cortical segmentations of the treated patients (total accuracy 48%; sens.: 42.9%, spec.: 53.1; p=0.6)

