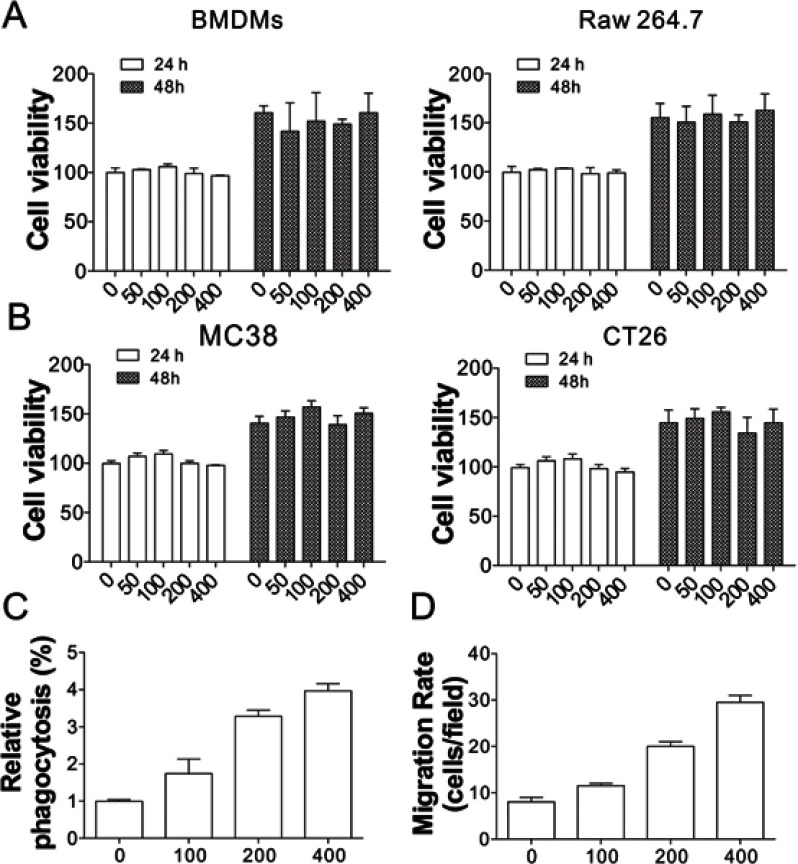
Figure 1.
Effects of PAM on MC38 cells and BMDMs. (A) The cell viability of BMDMs (left) and Raw 264.7 cells (right) treated with various concentrations of PAM (μg/mL) for 24 and 48 h. (B) The cell viability of MC38 (left) and CT26 (right) cells treated with various concentrations of PAM (μg/mL) for 24 and 48 h. (C) Both BMDMs and MC38 cells treated with different concentrations of PAM were stained with Celltracker CSFE or Far red and mixed for 2 h. Phagocytosis was analyzed by flow cytometry. (D) The migration of BMDMs co-cultured with MC38 cells was analyzed using the trans-well assay.

