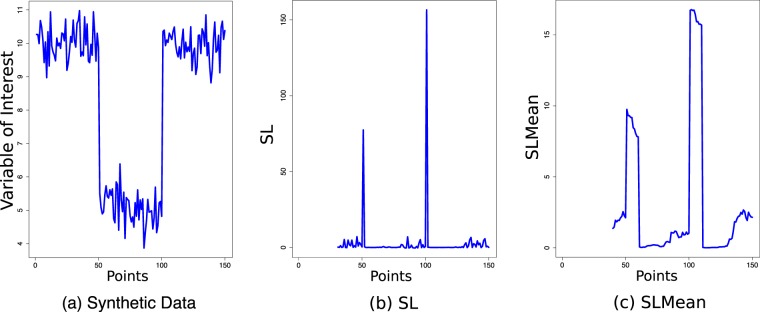
Figure 3.
Artificial example showing the calculation of SLMean from a synthetic dataset that was generated by concatenating 50 points, drawn independently from three univariate normal distributions with different means (5, 10, 15) and a standard deviation of 0.5. Computed with a moving time window of length 30 and the number of hidden states set to 1, the magnitude of SL intensified at the 50th and 100th time-points, where the parameters of the data-generating process changed, i.e., a proxy for transitions across different dynamical regimes.

