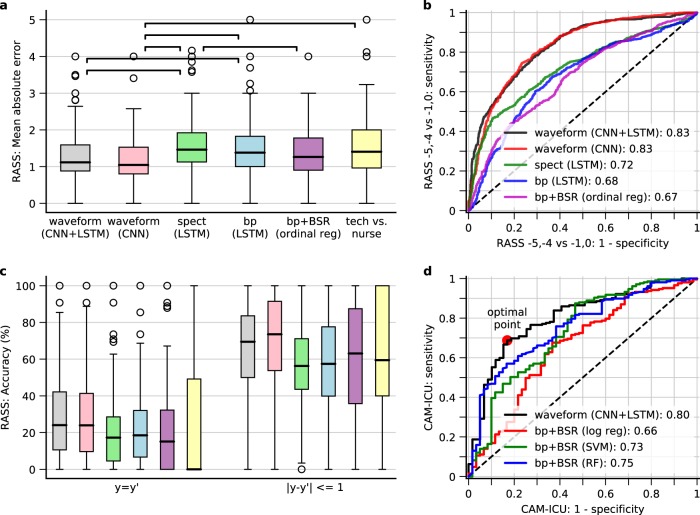
Fig. 1.
Tracking performance for level of consciousness and delirium. a Boxplot of the mean absolute error (MAE) between true and predicted RASS levels per patient in the pooled testing sets from all tenfolds. The upper, middle line, and bottom of the boxes are the 75% (Q3), 50% (median), 25% (Q1) percentiles, respectively. The whiskers extend to the smallest and largest value which is within [Q1–1.5 × IQR, Q3 + 1.5 × IQR]; circles are the outliers outside this range. The horizontal bars with stars indicate pairs with significantly different medians (p < 0.05). spect spectrogram, bp band power, BSR burst suppression ratio, tech research technician. b Receiver operator curves (ROC) when only focusing on RASS −5, −4 vs. −1, 0. The x-axis is the false-positive rate. The y-axis is the true positive rate. c Accuracy when allowing 0 (left) and 1 (right) level difference between true and predicted RASS. d ROC for detecting delirium. The markers indicate the optimal operating point according to different criteria as shown in Table 1

