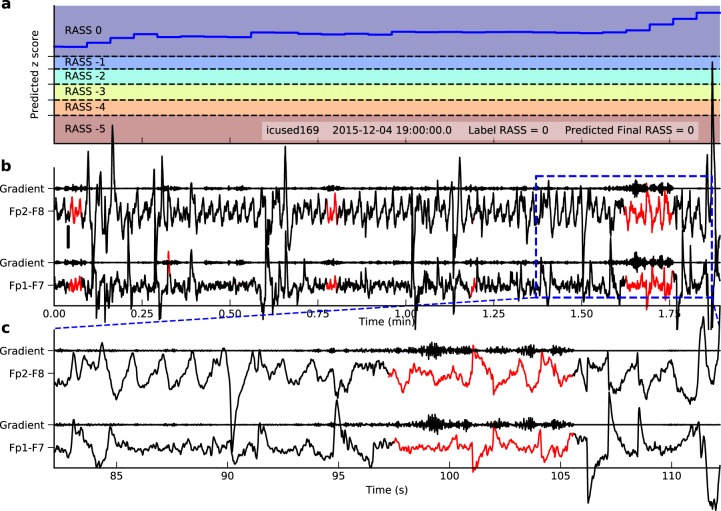
Fig. 4.
Interpretation of EEG patterns learned by the model for RASS 0 based on gradient information. a Trace of the predicted z-score and the thresholds to discretize it to RASS levels. Here the predicted RASS is always 0. b The corresponding signal and the gradient of the final z-score with respect to the signal. The red parts have gradient larger than the 95% percentile of the gradient in the segment. Time is in minutes. The scale is shown on the left middle side representing 50 µV. c A zoomed view of the blue dashed rectangle. Here time is in seconds. The EEG segment in red shows lateral eye movements, suggesting the patient is awake and looking around

