Fig. 2.
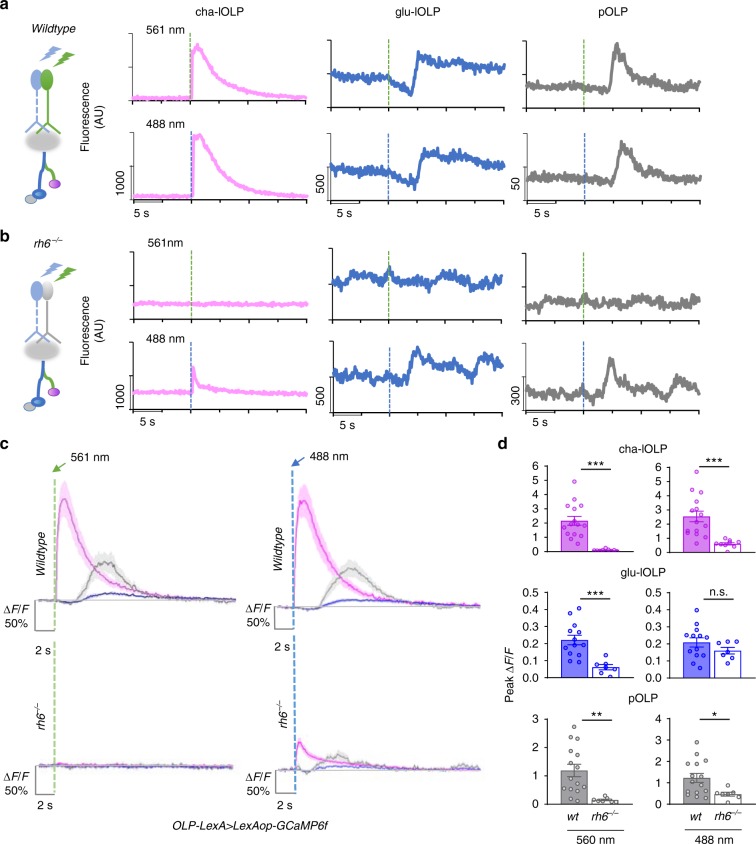
OLPs receive presynaptic inputs predominantly from Rh6-PRs. a, b The contribution of Rh5- and Rh6-PRs to light-evoked calcium responses in OLPs as revealed by stimulation at different wavelengths in wild-type and Rh6 mutants. Left: schematic diagram illustrating the stimulation scheme used in calcium imaging experiments. Green or blue light pulses (dashed lines, green: 561 nm, blue: 488 nm) activate Rh5- or Rh6-PRs and elicit OLP-LexA-driven GCaMP6f signals in the somas of OLPs. Right: Representative raw traces of OLP > GCaMP6f collected from wild-type and Rh6 mutants (rh6−/−). Magenta: cha-lOLP; blue: glu-lOLP; gray: pOLP. c, d OLPs are functionally connected to Rh6-PRs in the third instar larval brain. Light pulses (dashed lines, green: 561 nm, blue: 488 nm) induced fast calcium transients in cha-lOLP (magenta) and slow transients in glu-lOLP (blue) and pOLP (gray). Compared to wild-type controls, OLPs in Rh6 mutants showed no response towards green light (561 nm) stimulation and dampened responses toward blue light (488 nm) stimulation except for glu-lOLP, which remained equally responsive. The c average traces and d quantification of peak value of changed intensity (ΔF/F) are shown. Shaded areas on traces and error bars on quantifications represent SEM. Wild-type control: cha-lOLP, n = 15; glu-lOLP, n = 13; pOLP, n = 15. Rh6 mutant (rh6−/−): cha-lOLP, n = 9; glu-lOLP, n = 7; pOLP, n = 7. cha-OLP, 561 nm: p < 0.0001, t = 5.102, df = 22; cha-OLP, 488 nm: p = 0.0007, t = 3.929, df = 22; glu-OLP, 561 nm: p = 0.0009, t = 3.977, df = 18; glu-OLP, 488 nm: p = 0.2362, t = 1.225, df = 18; pOLP, 561 nm: p = 0.0044, t = 3.207, df = 20; pOLP, 488 nm: p = 0.0261, t = 2.402, df = 20. Statistical significance was determined by Student’s t test. p ≥ 0.05 was considered not significant (n.s.), ***p < 0.001, **p < 0.01, and *p < 0.05

