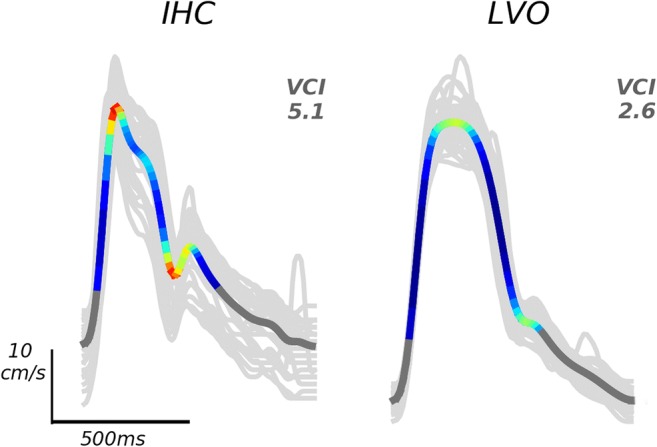
Fig. 1.

Example average beat waveforms from IHC (left), and LVO (right) groups are depicted with local curvature indicated by color. Areas of high curvature are shown in hot colors (red/yellow), whereas low curvature is indicated by cool colors (blue/green). Dark gray areas indicate time points not included in the beat “canopy,” where velocity is less than one quarter of its total diastolic-systolic range. Light gray traces depict individual beats over which each average was taken
