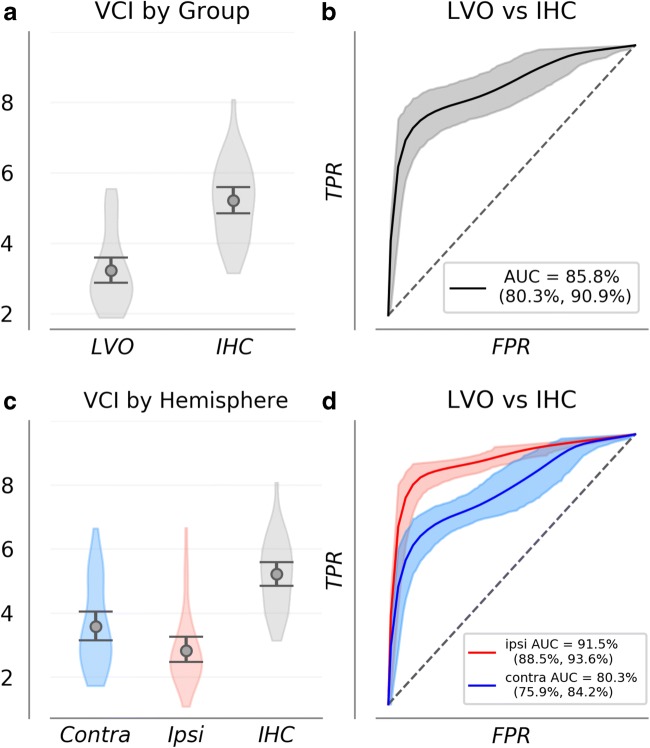
Fig. 2.
VCI distributions are shown for each group (a, c) along with bootstrapped ROC curves depicting group separability and empirical uncertainty (b, d). a shows VCI averaged over all recordings for each subject, combined across hemispheres. In c, the LVO group is separated by hemisphere relative to occlusion. Together, these curves demonstrate that VCI measurements from both hemispheres provide information concerning the presence of LVO. However, ipsilateral measurements are significantly more information rich. Light gray (b), and light blue/red (d) regions depict 95% confidence intervals on the true positive rate as a function of false positives

