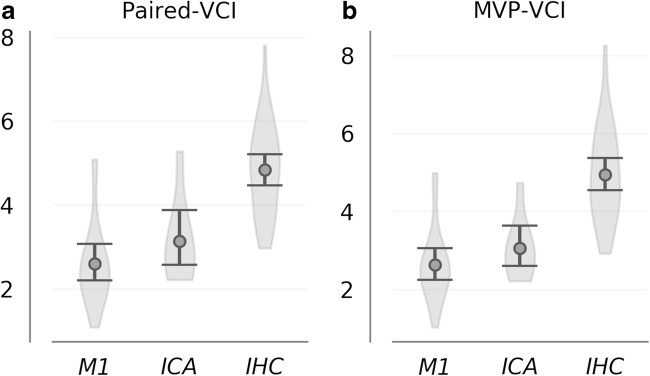
Fig. 4.
Paired-VCI (a) and MVP-VCI (b) curvature distributions are shown for subgroups corresponding to occlusion location; M1 (N = 20) vs ICA (N = 8) occlusions. While observed differences between M1 and ICA subgroups did not reach significance, those observed between each subgroup and corresponding IHC controls were highly significant; both for paired-VCI as well as MVP-VCI

