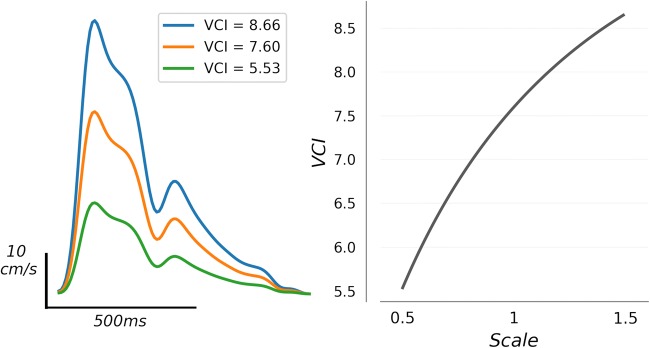
Fig. 5.
An example waveform (orange line, left column) is shown along with scaled versions of the same waveform indicated in green (scale factor 0.5), and blue (scale factor 1.5). The relation is depicted graphically in the right column, where VCI is computed for intermediate scales. The relation determines that when occlusion acts to dampen the waveform, this effect will be reflected in the VCI biomarker

