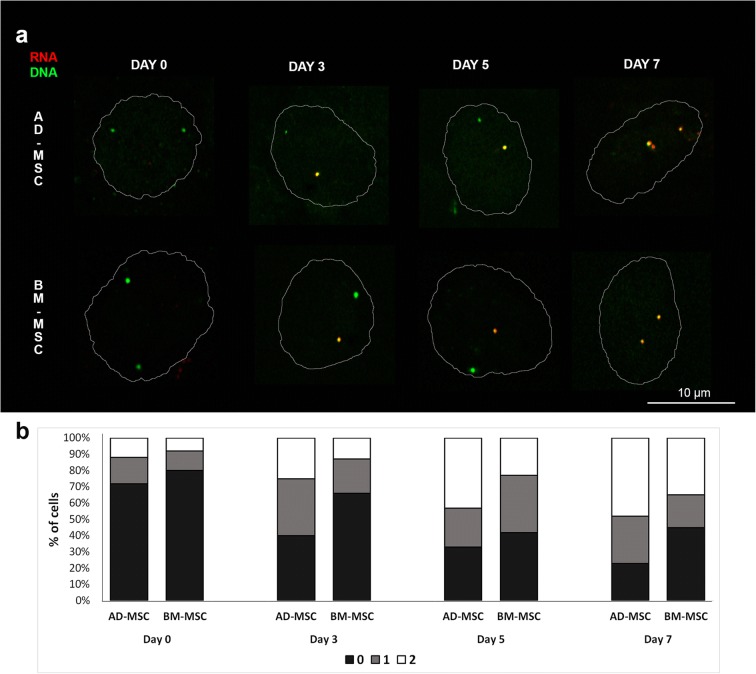
Fig. 4.
Detection of primary transcript of the PPARG gene during porcine in vitro adipogenesis. a 3D RNA/DNA-FISH was used to visualize pre-mRNA (red) and DNA locus (green). The limit of nuclear DAPI staining on confocal slices is shown by the white line. b The percentages of cells with 0, 1, or 2 active alleles on subsequent days of differentiation (nAD-MSC = 400, nBM-MSC = 400, P < 0.05). Note the preferential location of active alleles in the central part of nucleus and the unequal production of mRNA from both alleles

