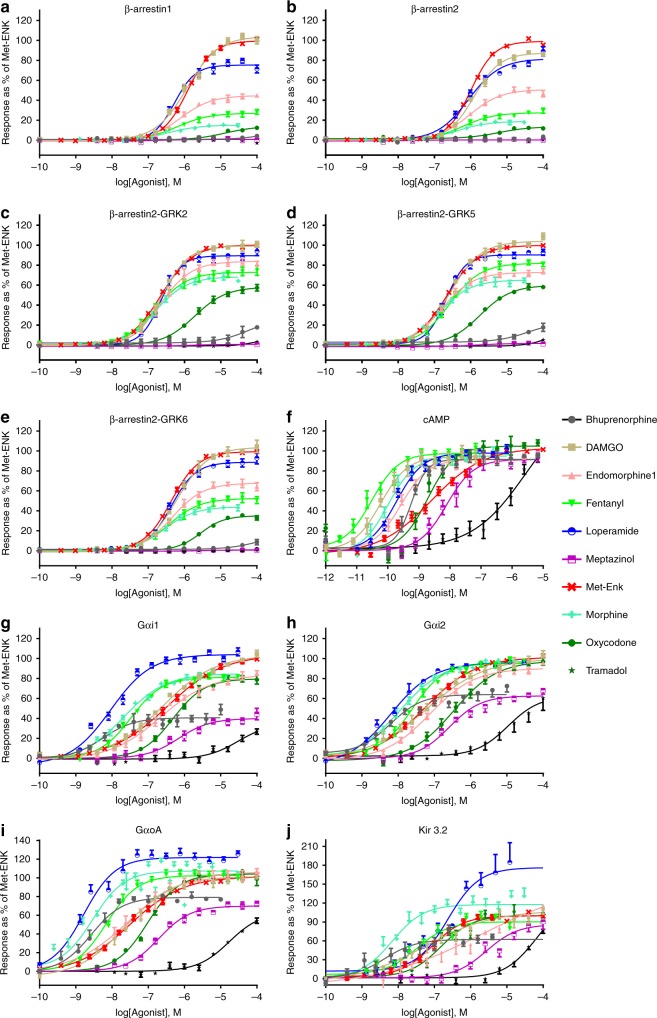
Fig. 2.
βarr recruitment and G-protein responses generated by opioid ligands. Responses for prescription opioids and known hMOR ligands were monitored using BRET-based biosensors. The results correspond to mean± SEM of at least three independent experiments, normalized to the maximal effect of Met-ENK, which was tested in all experimental runs (n = 16–29). Curves were fit with the operational model and the logistic equation (the results from the logistic fit are shown). a βarr1 recruitment, (b) βarr2 recruitment, (c) βarr2 recruitment in presence of GRK2, (d) βarr2 recruitment in presence of GRK5, (e) βarr2 recruitment in presence of GRK6, (f) cAMP, (g) Gαi1 activation, (h) Gαi2 activation, (i) GαoA activation, and (j) Kir3.1/3.2 activation. Net BRET values for Met-ENK are shown in Supplementary Fig. 5 and dose–response curves for all novel compounds appear in Supplementary Fig. 6. Operational and logistic parameters provided in Supplementary Data 1. Source data are provided as a source data file

