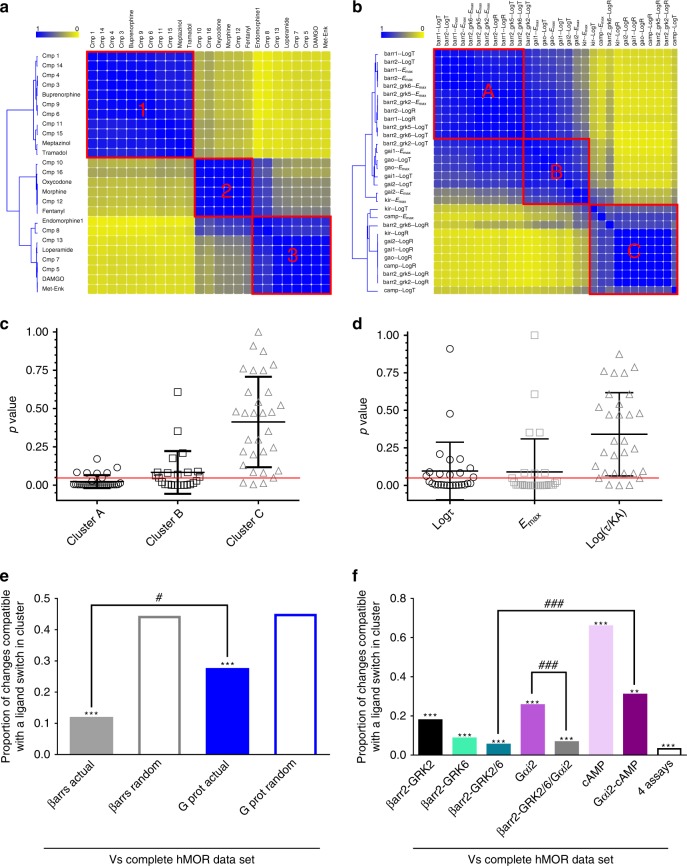
Fig. 3.
Assignment of hMOR ligands into clusters is primarily driven by βarr responses. Ligand (a) and parameter (b) similarity heatmaps for the complete hMOR data set. Yellow and blue, respectively indicate ligands/parameters that never or always cluster together. Distribution of parameters describing ligands within clusters shown in (a) was compared to their distribution in the whole population using a two-sample Kolmogorov–Smirnov test. Resulting p-values were plotted according to clusters shown in (b) (c) or to parameter type (d), mean ± SD are also shown. Red line: p = 0.05. Similarity matrices corresponding to partial data sets for βarr- or G-protein-mediated responses were compared with the complete, reference hMOR data set. Filled bars: proportion of ligands changing clusters when comparing actual βarr and G-protein data sets to the reference; empty bars: proportions observed by comparing simulations of random clustering to the reference data set. ***p < 0.001; -zscore βarr: −5.375; z-score G protein: −6.092. #p < 0.05; z-score difference: −2.22 (e). Similarity matrices generated for indicated partial responses were compared with the hMOR reference matrix. The results for actual data matrices are shown while results for random simulations were omitted. **p < 0.01; ***p < 0.001 comparing partial data sets to their randomized controls; z-scores for comparisons between actual and randomized data: βarr2-GRK2: −12.724; βarr2-GRK6: −10.583; βarr2-GRK2/GRK6:− 8.835; Gαi2: −7.315; cAMP: 6.297; Gαi2- cAMP: −2.351; four assays −8.541; βarr2-GKR2/6/Gαi2: −7.391. ###p < 0.001; z-score difference: βarr2-GRK2/6 vs. Gαi2/cAMP: −3.308; z-score difference: Gαi2 vs βarr2-GRK2/6-Gαi2: 3.754 (f). Source data provided in Supplementary Data 1 and as a source data file

