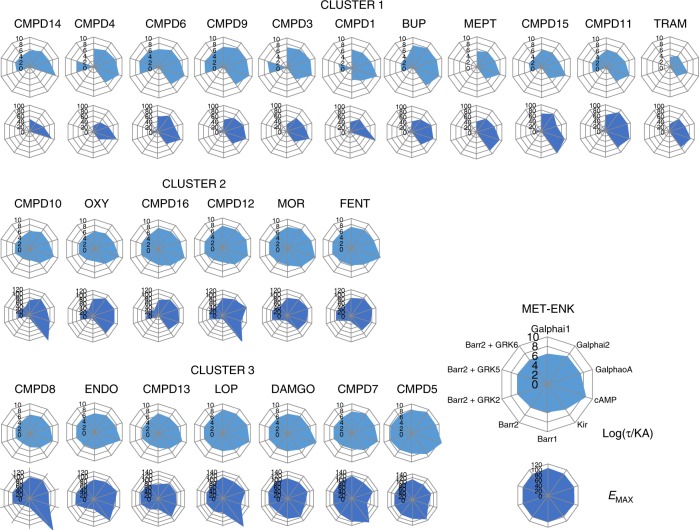
Fig. 4.
Graphic representation of operational and logistic parameters for hMOR ligands populating different clusters. Operational transduction coefficients (Log(τ/KA)) and logistic Emax values derived from concentration response curves generated by hMORs at ten different biosensors were represented as radial graphs. Each radius corresponds to the magnitude of Log(τ/KA) or Emax values. Transduction coefficients are in logarithmic scale, Emax values were normalized to maximal Met-ENK response, and are presented on linear scale. Source data provided in Supplementary Data 1

