Fig. 5.
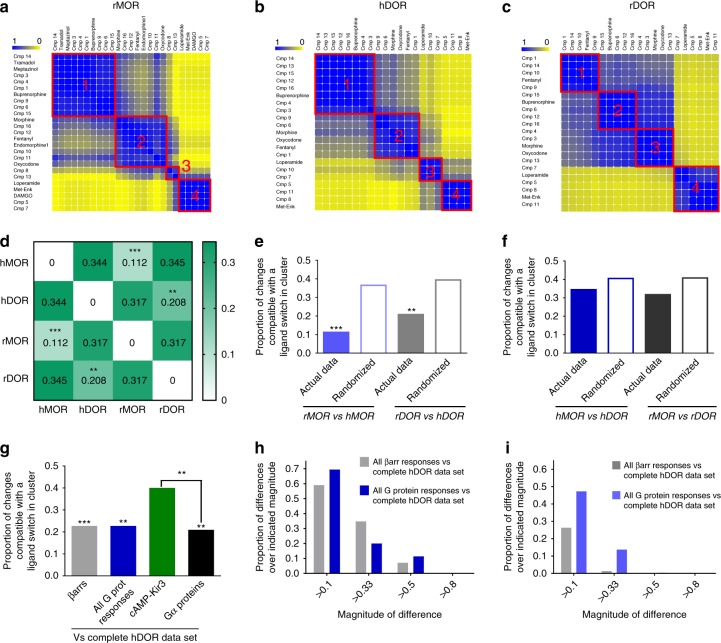
Signaling profiles of opioid receptor ligands are conserved across species but not receptor subtypes. Ligand similarity heatmaps for rat MOR (a), human DOR (b), and rat DOR (c) data sets. Yellow and blue, respectively, indicate ligands/parameters that never or always cluster together. Proportion of ligands changing cluster for indicated comparisons; **p < 0.01, ***p < 0.001 comparing actual to randomized data sets as in Fig. 3 (d). Similarity matrices for the same receptor compared across species. Filled and empty bars: proportion of ligands changing clusters when, respectively, comparing actual data and random clustering simulations to the reference matrix; **p < 0.01, ***p < 0.001; z-score MOR subtypes: −7.153; z-score DOR subtypes: −2.742 (e). Similarity matrices for receptor subtypes within species compared as in (e). Actual and randomized data sets did not differ: z-score hMOR vs. hDOR: −1.502; z-score rMOR vs. rDOR subtypes: −1.567 (f). Similarity matrices for βarr- or G protein-partial data sets were compared with the complete hDOR matrix as in (e); only comparisons for actual data are shown; **p < 0.01, ***p < 0.001; z-scores versus corresponding randomized data: βarr: −3.309; G protein: −2.644; cAMP-Kir3.2: −0.309, Gα proteins: −3.286. ##p < 0.01; z-score difference: cAMP-Kir3.2 vs. Gα proteins: 2.515. p = 0.256; z-score difference βarrs vs. All G prot responses: −0.656 (g). A difference was calculated between every valueij in the complete hDOR matrix and corresponding valueij in indicated partial data sets. Histogram shows the fraction of differences with absolute value above indicated thresholds (h). Calculations described in (h) were repeated for the complete hMOR matrix and partial data sets for βarr or G protein (i). Source data provided in Supplementary Data 7, 8, and 9 and source data files

