
Fig. 6.
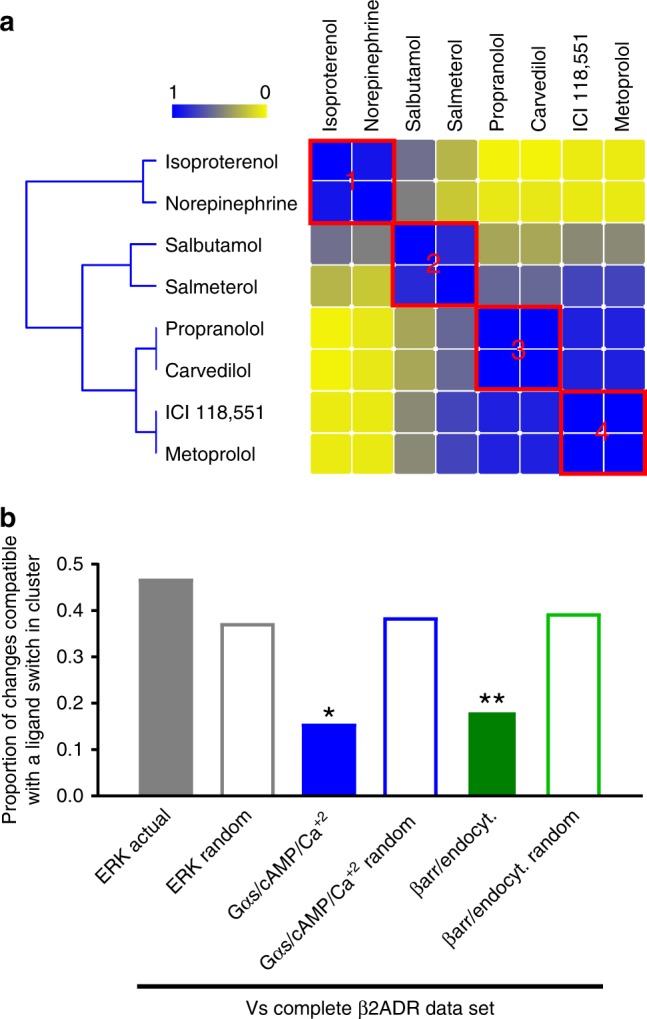
β2ADR ligands cluster according to similarity in G protein and βarr-mediated responses. Ligand similarity heatmaps for hβ2ADRs. Yellow and blue, respectively, indicate ligands/parameters that never or always cluster together. (a). Similarity matrices for partial data sets corresponding to ERK, G protein- (Gαs, cAMP, Ca+2), and βarr2- (recruitment, endocytosis) mediated responses were compared with the reference hβ2ADRs data set. Filled bars: proportion of ligands changing clusters when comparing actual ERK, G protein, and βarr2 data sets to the reference; empty bars: proportions observed comparing the reference data set to corresponding simulations of random clustering for partial matrices. *p < 0.05, **p < 0.01; z-score ERK: 1.523; z-score G protein: −2.446 and z-score βarr: −2.636 (b). Source data provided in Supplementary Data 10 and source data files