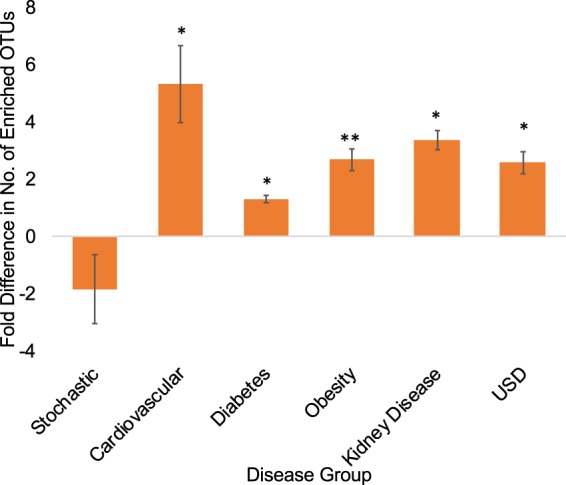
Figure 3.

Average fold difference in the number of OTUs enriched in either the healthy group/stochastic group 1 or in the disease group/stochastic group 2. Positive values reflect greater enrichment in healthy group/stochastic group 1, whereas negative values reflect greater enrichment in disease group/stochastic group 2. Significance was determined with a one-sample t-test against an expected value of 1. *p < 0.05; **p < 0.01; ***p < 0.001.
