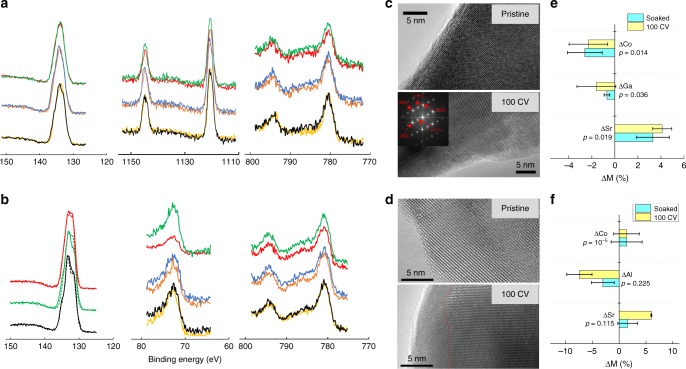
Fig. 3.
Structural and compositional stability of Sr2GaCoO5 under oxygen evolution conditions in neutral-pH. a X-ray photoelectron spectroscopy results for Sr 3d (left), Ga 2p (middle) and Co 2p (right) signal in Sr2GaCoO5. b X-ray photoelectron spectroscopy results for Sr 3d (left), Al 2p (middle) and Co 2p (right) signal in. Each figure contains three groups of spectra, corresponding to pristine sample (bottom), sample soaked in the electrolyte for four hours (middle) and sample after 100 cyclic voltammetry cycles from 1.0 to 1.7 V (top). For each group, the bottom one shows the signal from fresh surface and the top one shows the signal after Ar+ sputtering for 16 min The signal of Al is magnified by 10 times for better visualization. c, d HRTEM images of Sr2GaCoO5 (c) and Sr2AlCoO5 (d) for pristine sample and for sample after 100 cyclic voltammetry scans from 1.0 to 1.7 V. The insert in c shows the indexed selected area electron diffraction. The red line marked the boundary between the crystalline and amorphous regions. e Difference of cation content between on the surface and in the bulk of Sr2GaCoO5 from 10 energy dispersive spectroscopy measurements. f Difference of cation content between on the surface and in the bulk of Sr2AlCoO5 from 15 energy dispersive spectroscopy measurements. The statistical significance of the difference between soaked and cycled samples was evaluated in the equivalence test, designed as two one-side t-tests to test if the difference is larger than θ or smaller than −θ, where the acceptance criterion θ was chosen to be the average standard deviation of metal content, 2%, for Sr2GaCoO5. Due to the obviously larger change of Sr and Al contents in Sr2AlCoO5 samples, we used a larger acceptance criterion θ, 5%, in the test. The largest p-value at 95% confidence level is reported on the graph

