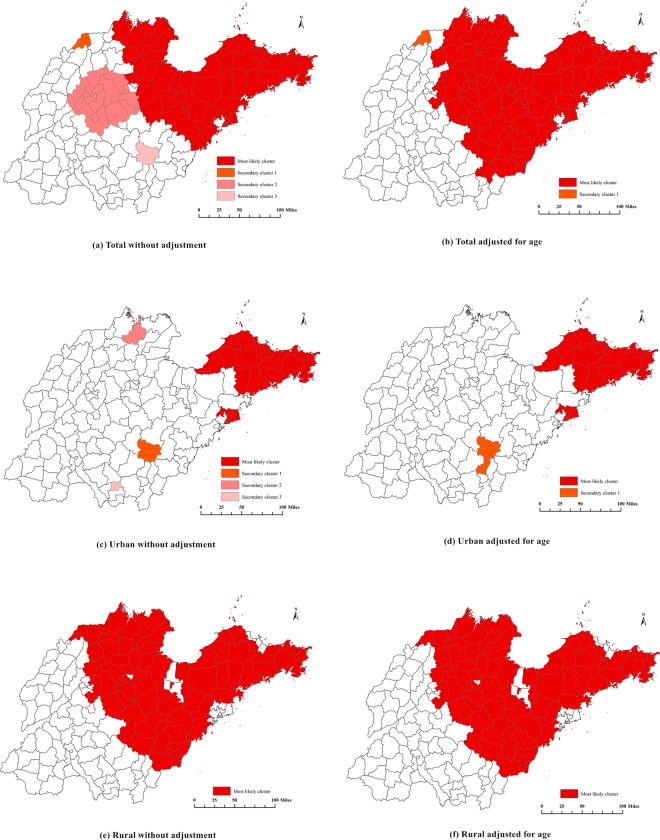
Figure 2.
Pancreatic cancer mortality clusters at the county level in Shandong for the years 2011 to 2013 using the spatial scan statistical analysis. (a) Total without adjustment (most likely cluster, secondary cluster 1, 2 and 3); (b) Total adjusted for age (most likely cluster and secondary cluster 1); (c) Urban without adjustment (most likely cluster, secondary cluster 1, 2 and 3); (d) Urban adjusted for age (most likely cluster and secondary cluster 1); (e) Rural without adjustment (only one most likely cluster); (f) Rural adjusted for age (only one most likely cluster).

