Fig. 3.
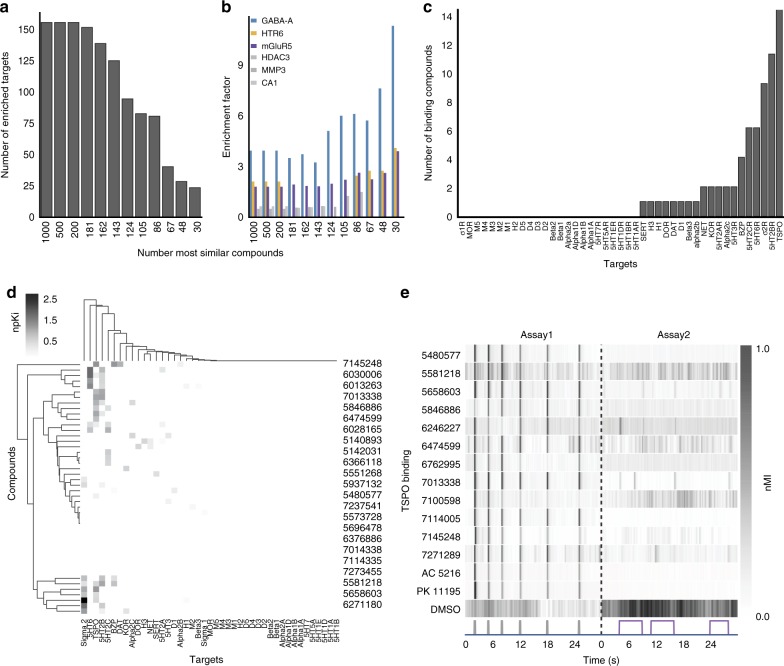
Potential targets include GABAAR, mGluR, TSPO, and HTR6. a SEA analysis was performed on decreasing numbers of hit compounds (1000-30). The bar plot shows the number of SEA enriched targets decreasing as the analysis focuses on the top 30 hit compounds. b The bar plot shows increasing enrichment of GABAAR, HTR6, and mGluR5 as the top targets predicted for the top 30 hit compounds. c This bar plot shows the number of 46 primary hit compounds (y-axis) that bound to the indicated CNS receptors (x-axis). d The clustergram shows binding affinity profiles at the indicated CNS receptors. The colorbar indicates normalized Ki (npKI). e Heatmap of average motor activity profiles for TSPO binding compounds (y-axis) over time (x-axis) (n = 12 wells). Assay 1 is comprised of 6 low-amplitude acoustic stimuli (gray); Assay 2 is a series of 3 violet light pulses (violet). These two assays are separated by a dotted line. AC 5216 and PK 11195 are TSPO binding compounds. Abbreviations: nMI, normalized motion index; MMP3, matrix metallopeptidase 3; CA1, carbonic anhydrase 1; HDAC3, histone deacetylase 3

