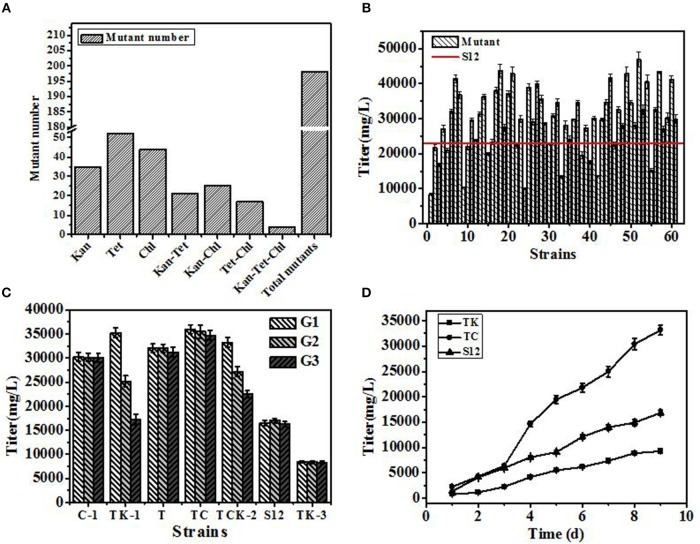
Figure 3.
The results of the developed breeding process. (A) Number of mutants selected in resistance screening. (B) Titer of salinomycin production by mutants grown in shaking flask culture. (C) Genetic stability of selected mutants after 3 generations. (D) Titer of salinomycin production by mutants TK, Tet30Chl25, and the initial strain S12 grown in shaking flask culture. Error bars indicate standard error of the mean.

