
Figure 4.
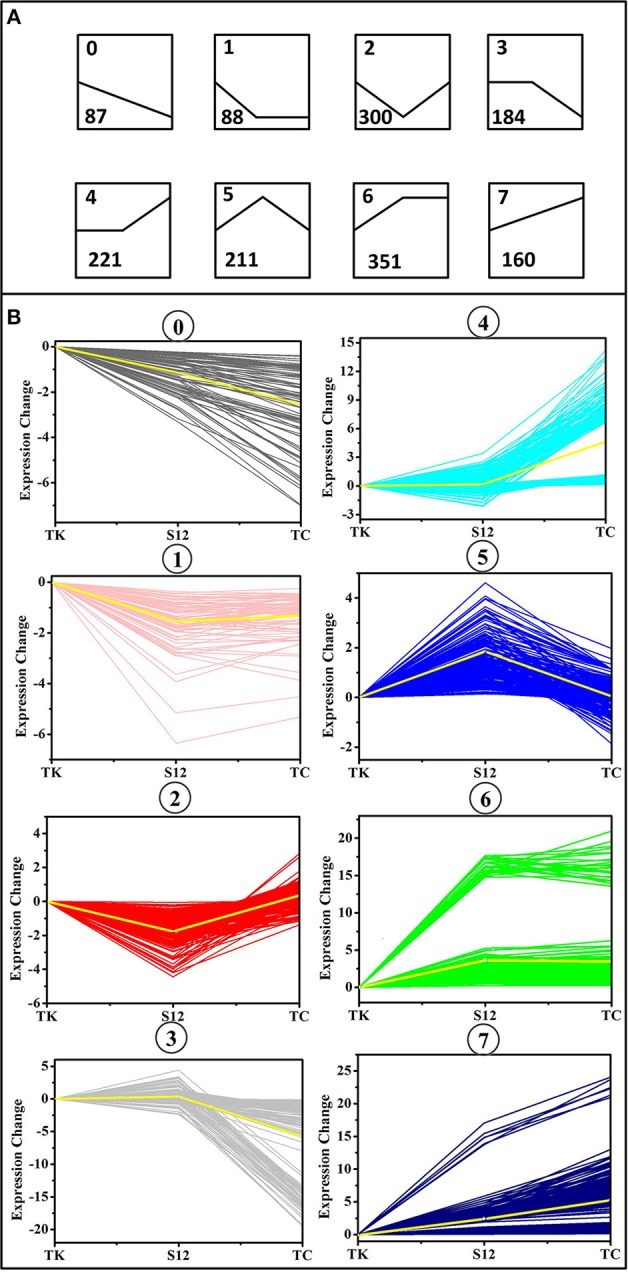
Clusters of differentially expressed genes (DEGs) between the mutant strain TK, Tet30Chl25, and the initial strain S12. (A) Eight trend models used by gene clustering analysis. The number in the upper left corner of each trend represents the type number to which the trend belongs, and the number in the lower left corner represents the number of genes that fall into the trend. (B) Clusters of differentially expressed genes (DEGs) under various salinomycin production environment. The X axis represents mutants TK, Tet30Chl25, and the parental strain S12 respectively.