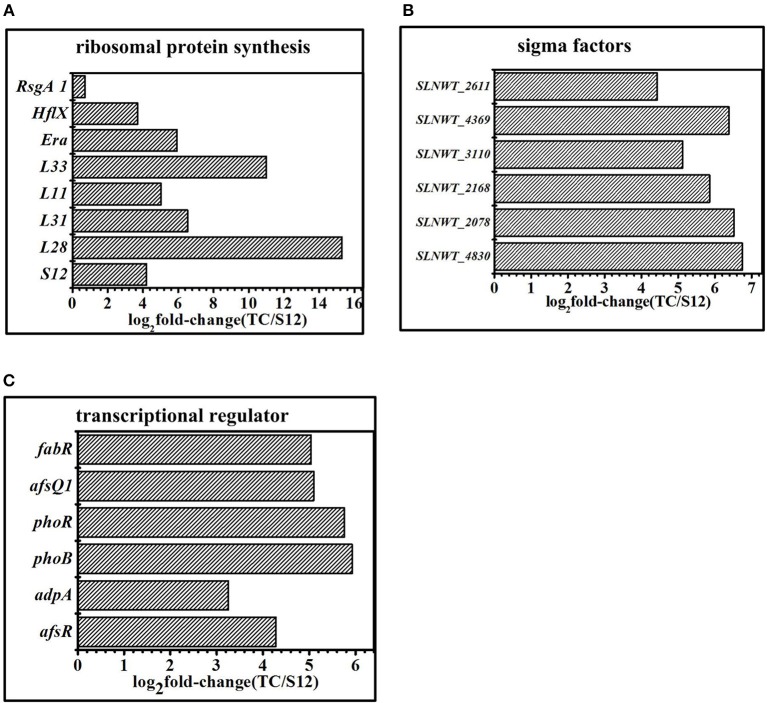
Figure 8.
Transcriptomic analysis of the mutants and the original strain S12 at the 5 days in fermentation medium. (A) Expression of genes related to ribosomal protein. (B) Expression of genes related to sigma factors. (C) Expression of genes related to transcriptional regulator. Histograms show the abundance of the transcripts with significant variations (p-value<0.05) discussed in the text. Abundance values are shown in log2 fold-change (TK/S12). For detail genes expression (see Table S7).

