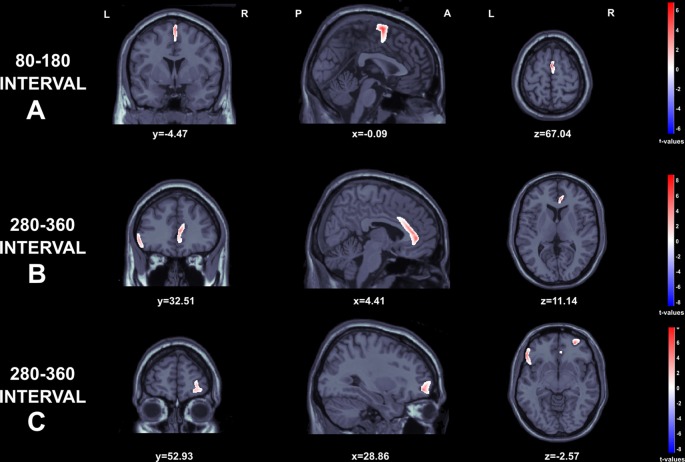
Figure 5.
Graphical representation of the Standardized Low Resolution Electromagnetic Tomography (sLORETA) t-statistics comparing the ERPs for gains and losses at the time point of the individual peak over 80–180 s interval (A) and 280–360 s intervals (B and C). Red color indicates local maxima of increased electrical activity for loss compared to winresponses in an axial, a sagittal and a coronal slice through the reference brain.

