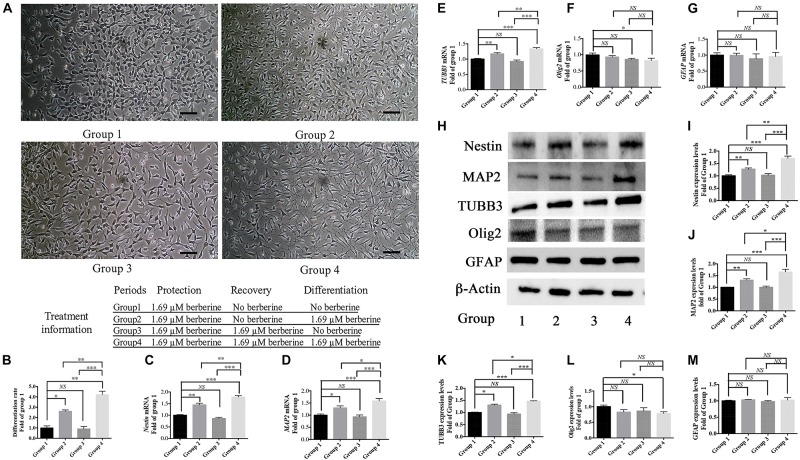
FIGURE 4.
Berberine induced neuronal differentiation of AAPH-damaged C17.2 cells. (A) Cell differentiation in group 1, group 2, group 3, and group 4. (B) Differentiation rate in group 1, group 2, group 3, and group 4. (C–G) mRNA levels of Nestin (C), MAP2 (D), TUBB3 (E), Olig2 (F), and GFAP (G) in Group 1, 2, 3, and 4. (H) Western blot analysis of Nestin, MAP2, TUBB3, Olig2, and GFAP in Group 1, 2, 3, and 4. (I–M) Quantification of protein blots. Group 1 was set as the control. The data represent the mean ± SEM. ∗P < 0.05, ∗∗P < 0.01, and ∗∗∗P < 0.001.

