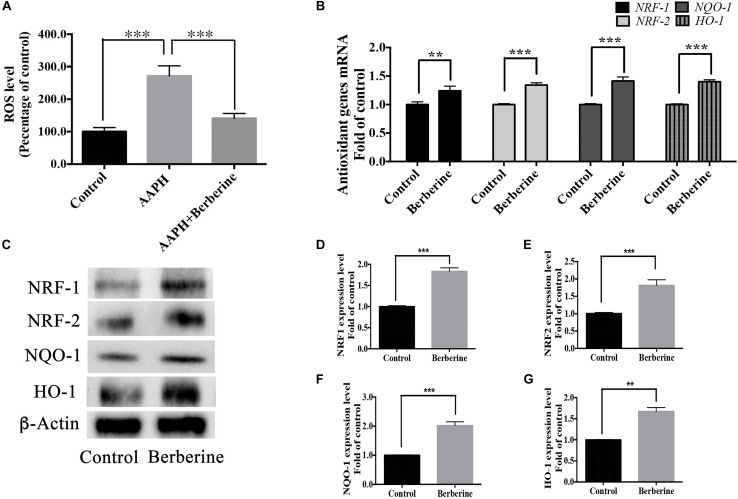
FIGURE 7.
Antioxidant pathway of berberine. (A) Detection of ROS levels in Step one. (B) mRNA levels of antioxidant genes NRF-1, NRF-2, HO-1, and NQO-1. (C) Western blot analysis of NRF-1, NRF-2, HO-1, and NQO-1 in Step one. (D–G) Quantification of protein blots. Group 1 was set as the control. The data represent the mean ± SEM. ∗∗P < 0.01 and ∗∗∗P < 0.001.

