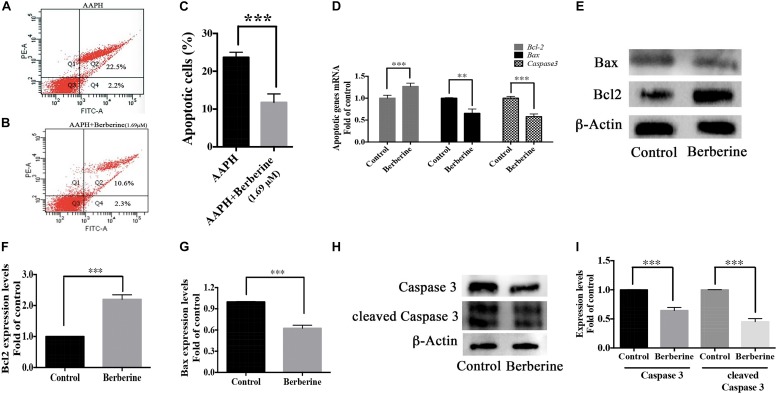
FIGURE 8.
Antiapoptotic pathway of berberine. (A–C) Cell apoptosis detected by flow cytometry, (A) AAPH (7.38 mM) treated cells; (B) AAPH (7.38 mM) and berberine (1.69 μM) treated cells. (C) Apoptotic cells percentage (Q2 + Q4, calculated from three independent experiments). (D) mRNA levels of anti-apoptotic gene (Bcl-2) and apoptotic genes (Bax and Caspase 3) in Step one. (E) Western blot analysis of Bcl-2 and Bax in Step one. (F,G) Quantification of protein blots. (H) Western blot analysis of Caspase 3 and cleaved Caspase 3 in Step one. (I) Quantification of protein blots. The data represent the mean ± SEM. ∗P < 0.05, ∗∗P < 0.01, and ∗∗∗P < 0.001.

