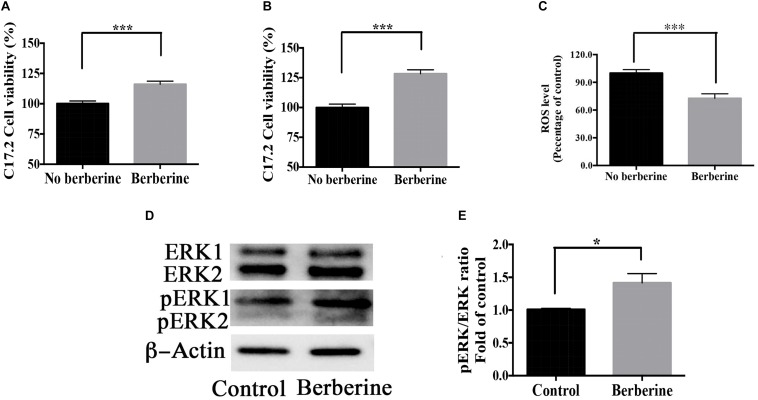
FIGURE 9.
Berberine promoted cell viability during recovery period. (A,B) C17.2 cell viability after berberine treatment on recovery day 1 (A) and day 2 (B) in Step Two. (C) ROS level detection on recovery day 2 in Step Two. (D) Western blot analysis of ERK and pERK in Step Two. (E) Quantification of protein blots. The data represent the mean ± SEM. ∗P < 0.05, ∗∗P < 0.01, and ∗∗∗P < 0.001.

