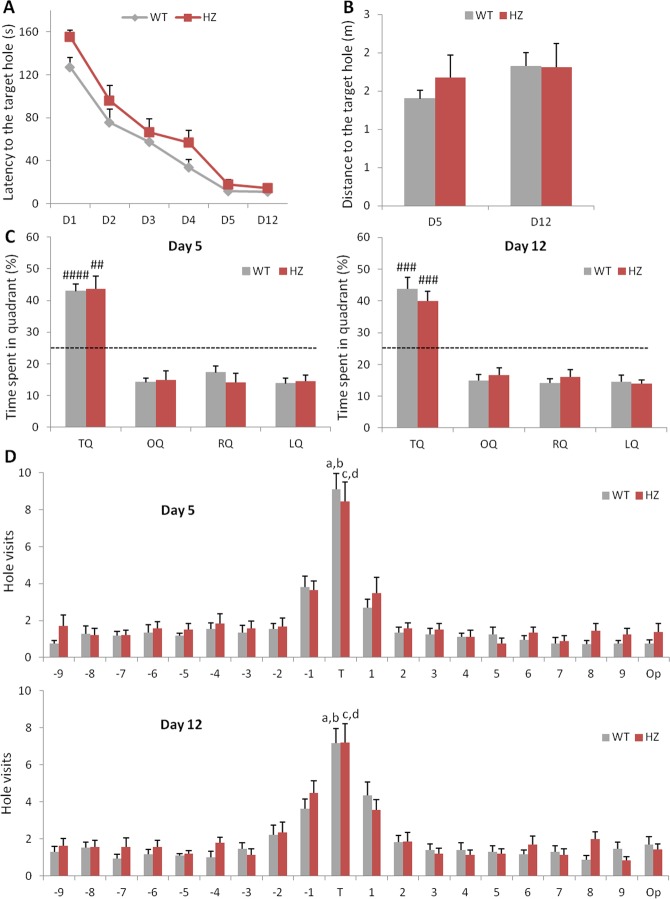
Figure 6.
Adult WT and Scn2a+/− mice show comparable spatial memory performance in the Barnes maze test. (A) During the training days (day1–4), Scn2a+/− mice showed a trend towards a significant slower acquisition latencies, but, during the probe trials on days 5 and 12, the latency and (B) the distance traveled before finding the target hole did not differ between genotypes. (C) Percentage of time spent in the correct quadrant, where the target hole was located, and in the other quadrants (one sample t-test, ##p < 0.005, ###p < 0.0005, ####p < 0.00001 vs chance level). (D) Number of visits to each hole on day 5 (Paired t-test: ap < 0.0005 vs -1 hole, bp < 0.0001 vs +1 hole for WT; cp < 0.005 vs -1 hole, dp < 0.0005 vs +1 hole for Scn2a+/−) and day 12 (Paired t-test: ap = 0.001 vs -1 hole, bp = 0.005 vs +1 hole for WT; cp < 0.05 vs -1 hole, dp < 0.01 vs +1 hole for Scn2a+/−). Dashed line indicates chance performance (25%). T = Target, O = Opposite, L = Left, R = Right. (WT, n = 17; Scn2a+/−, n = 14).

