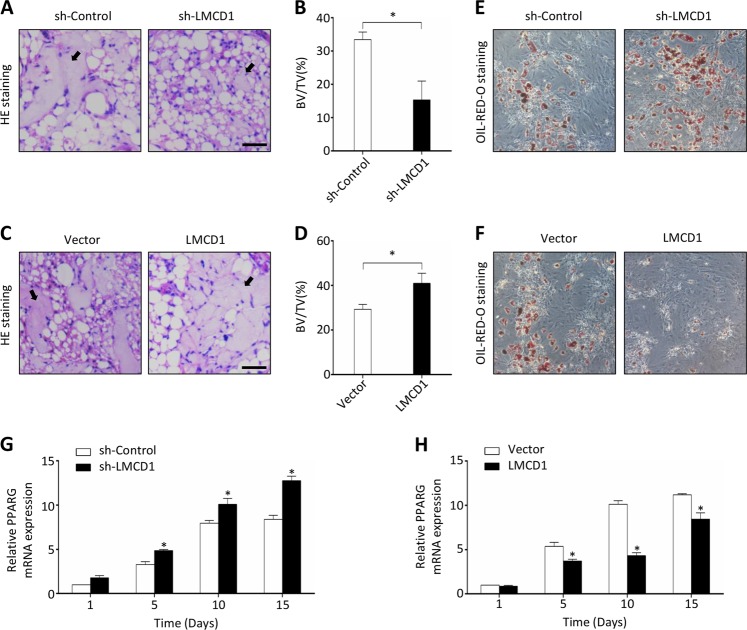
Fig. 3. The role of LMCD1 in osteogenic differentiation in vivo.
a Representative H&E staining images of transplants from sh-Control group and sh-LMCD1 group. Black arrow represents newly formed bone. Scale bar represents 100 µm. b Quantitative measurement of bone formation. c Representative H&E staining images of transplants from Vector group and LMCD1 group. Black arrow represents newly formed bone. Scale bar represents 100 µm. d Quantitative measurement of bone formation. e, f The adipogenic differentiation was measured by Oil-red-O staining after BMSCs were cultured with adipogenic induction medium for 14 days. g, h The expression of PPARG was measured by qRT-PCR during the adipogenic differentiation process of BMSCs

