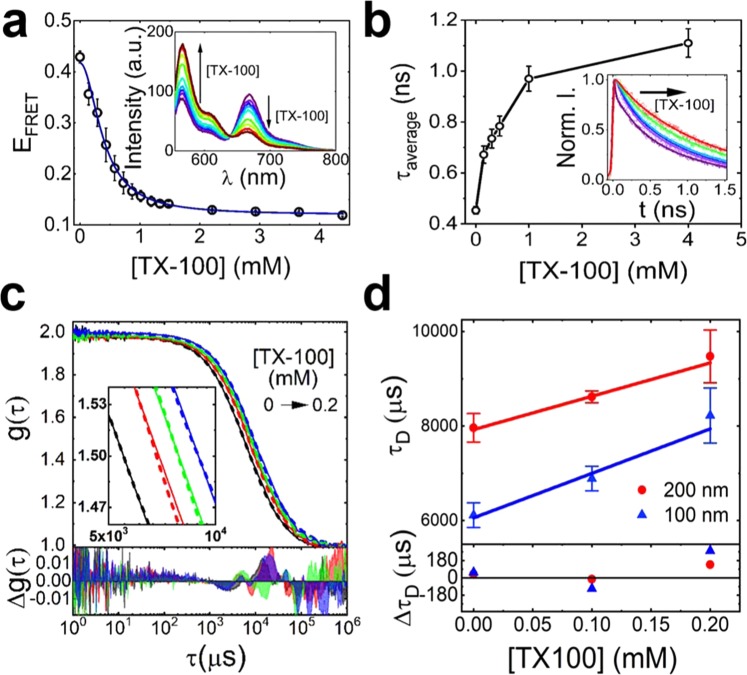
Figure 1.
TX-100 vesicle interactions reported using ensemble FRET and FCS. (a) FRET efficiency of Dil/DiD labeled vesicles versus TX-100. The solid line represents a Hill model fit. Inset: corresponding variation in fluorescence spectra. (b) Average lifetime of Dil versus TX-100. Inset: corresponding time-resolved fluorescence decays. Solid lines represent bi-exponential fits. (c) Top: FCS cross-correlation curves (solid lines), fits (dashed lines) (inset: zoomed in) associated with 100 nm-(black) and 200 nm-sized (red) vesicles. Also shown are FCS curves for 200 nm-sized vesicles in the presence of 0.1 mM (green) and 0.2 mM (blue) TX-100. Bottom: residuals of the fits. (d) Top: Diffusion times of NBD-PC labeled vesicles as a function of TX-100. A PC: PS lipid ratio of 65: 35 was used under all conditions. Solid lines represent linear fits. Bottom: corresponding residuals.

