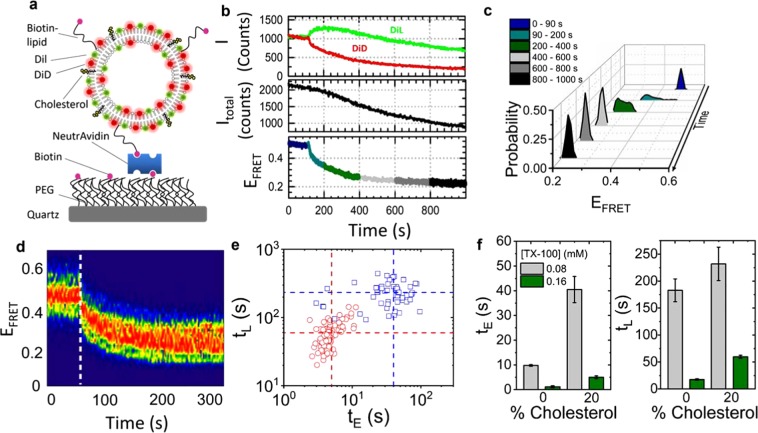
Figure 2.
Real-time visualization of solubilization kinetics by svFRET. (a) Schematic of the immobilization scheme. The schematic is for illustration purposes only and is not to scale. (b) Representative variation in the fluorescence emission of Dil and DiD (top panel), the sum of their intensities (middle panel) and the corresponding variation in FRET efficiency obtained before (<90 s) and after (>90 s) injection of 0.16 mM TX-100. (c) Relative FRET state occupancies observed over 1000 s. (d) FRET contour plot showing the variation in EFRET before and after TX-100 injection (dashed white line) (N = 105). (e) Corresponding scatter plot of expansion half-live, tE versus that of lysis, tL obtained after injection of 0.08 mM (blue) and 0.16 mM (red) TX-100. Dashed lines represent the center of each distribution. (f) Comparative bar plots summarizing the variation in tE and tL as a function of TX-100 and percentage of cholesterol incorporated within the vesicle bilayer. Error bars indicate the standard error of the mean.

