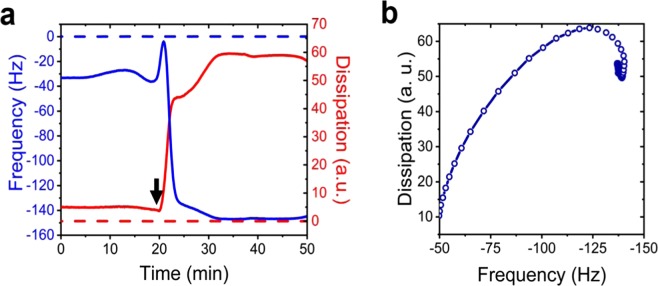
Figure 3.
TX-100 induced vesicle solubilization monitored by QCM-D. (a) Variation in frequency (blue) and dissipation (red) of the 7th overtone associated with surface immobilized vesicles in the presence of TX-100. The dashed lines represent data collected from a control sensor pre-treated with PEG and NeutrAvidin, but lacks vesicles. The arrow indicates the time-point of the solubilization. (b) Frequency versus dissipation observed during the interaction between surface immobilized vesicles and TX-100.

