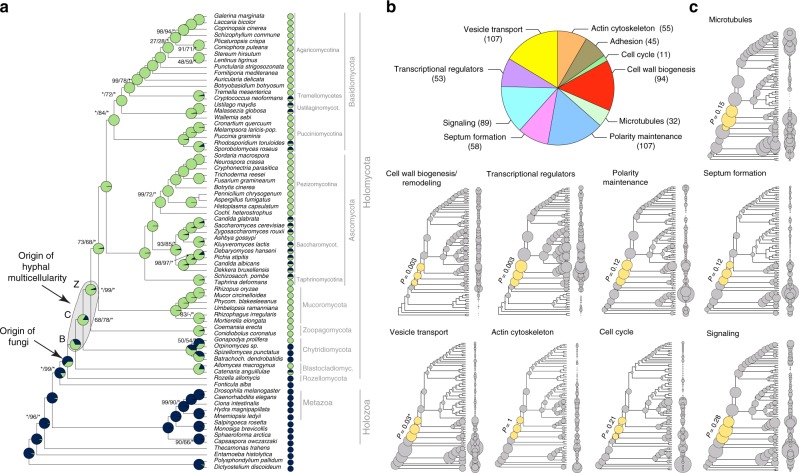
Fig. 1.
The evolution of hyphal multicellularity and underlying genes in fungi. a Phylogenetic relationships among 72 species analyzed in this study. Pie charts at nodes show the proportional likelihoods of hyphal (green) and non-hyphal (dark blue) ancestral states reconstructed using Bayesian MCMC. Character state coding of extant species used in ancestral state reconstructions is shown next to species names. BCZ nodes: origins of hyphal growth could be assigned with confidence are highlighted (note the uncertainty imposed by filamentous Blastocladiomycota). Support values next to branches are given for nodes that received less than maximal support in at least one analysis. Support values are given as ML boostrap (RAxML)/ML bootstrap (IQ-Tree)/Bayesian posterior probabilities (Phylobayes). Asterisk (*) denotes maximal support in a given analysis. b the distribution of literature-collected hypha morphogenesis genes among 10 main functional categories. c Ancestral reconstructions of gene copy number in 9 main hypha morphogenesis-related categories of genes (see Fig. 2c for adhesion). Bubble size is proportional to reconstructed ancestral gene copy number. BCZ nodes are shown in yellow. P-values of enrichment of duplications are shown next to each tree (Fisher’s exact test, FDR correction). *For vesicle transport the P-value indicates significant depletion of duplications in BCZ nodes

