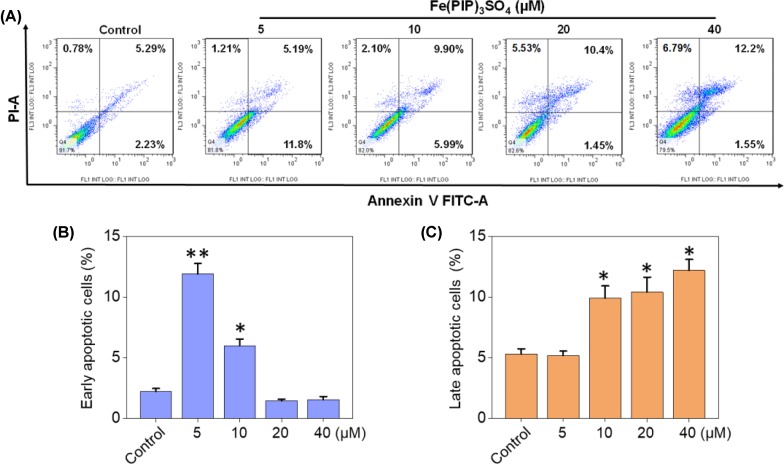
Figure 3.
Cell apoptotic analysis induced by Fe(PIP)3SO4. (A) Flow cytometric analysis for Annexin V–FITC/PI in U87 cells treated with Fe(PIP)3SO4 (5, 10, 20, and 40 μM, respectively) for 36 h. The percentage of Annexin V–positive and PI-negative cells (bottom right) represents the proportion of early apoptotic cells; the percentage of Annexin V–positive and PI-positive cells (top right) represents the proportion of late apoptotic cells. (B) Quantitative analysis of early apoptotic U87 cells induced by Fe(PIP)3SO4 (5, 10, 20, and 40 μM, respectively) after 36 h of incubation. Values are presented as means ± SD in triplicate. Significant difference between the treatment and control groups was indicated at the P<0.05 (*) or P<0.01 (**) level. (C) Quantitative analysis of late apoptotic U87 cells induced by Fe(PIP)3SO4 (5, 10, 20, and 40 μM, respectively) after 36 h of incubation. Values are presented as means ± SD in triplicate, and significant difference between the treatment and control groups is indicated at the P<0.05 (*) level.

