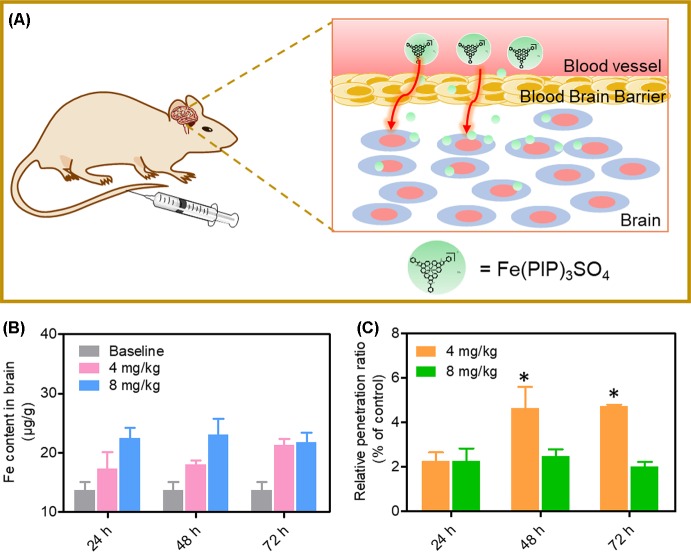
Figure 8.
In vivo biodistribution of Fe content in the brains after administration (i.v.). (A) Schematic diagram for the experimental design. (B) In vivo Fe content in the brains after i.v. administration for 24, 48, and 72 h, respectively. The gray histograms were represented for the control group; the pink and blue histograms were represented for Fe content levels in brain treated with Fe(PIP)3SO4 (4 and 8 mg/kg, respectively). Values are presented as means ± SD in triplicate. Significant difference between treatment groups was indicated at the P < 0.05 (*) level. (C) Relative penetration ratio across BBB after i.v. administration for 24, 48 and 72 h, respectively. The yellow and green histograms were represented for the Fe content inside the brains treated with Fe(PIP)3SO4 (4 and 8 mg/kg, respectively). Values are presented as means ± SD in triplicate. Significant difference between treatment groups is indicated at the P < 0.05 (*) level.

