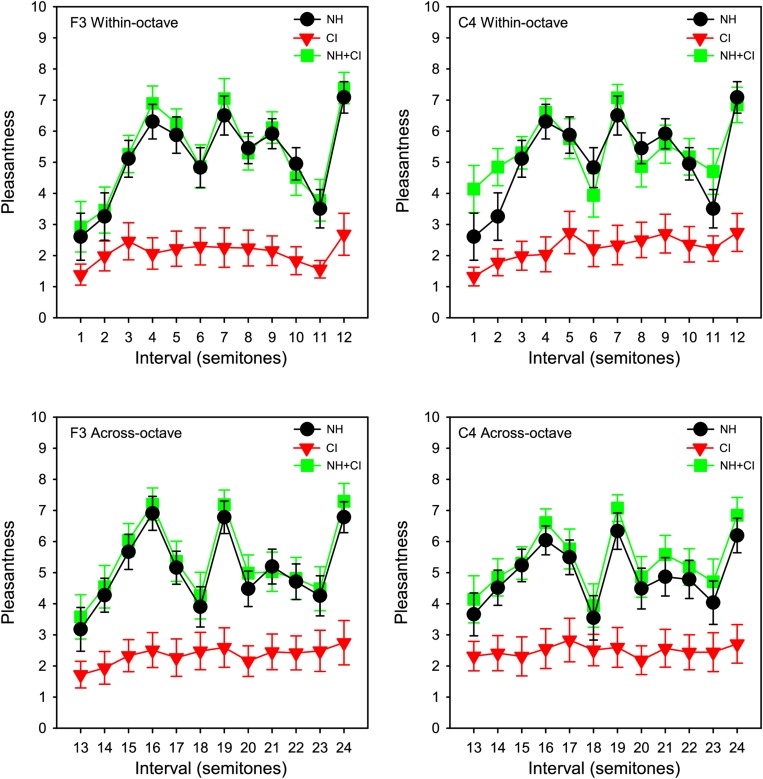
FIGURE 1.
Mean pleasantness ratings for SSD-CI participants (n = 11) with NH-only (black), CI-only (red), and NH + CI (green) listening as a function of interval size. Interval size in semitones is shown on the abscissa. Data for the F3 and C4 root notes are shown in the right and left columns, respectively. Data for within- and across-octave intervals are shown in the top and bottom rows, respectively. The error bars show the standard error.

