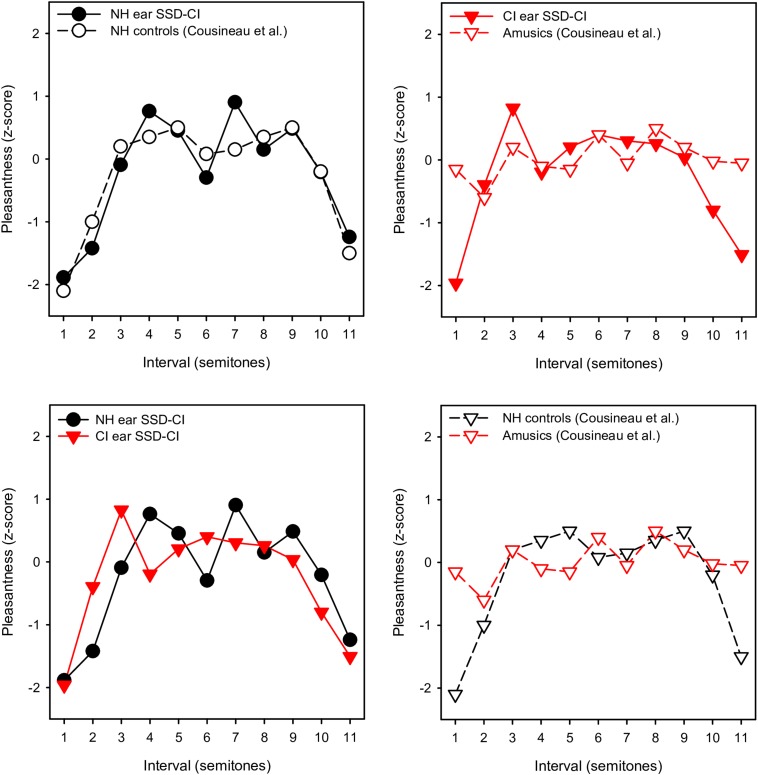
FIGURE 4.
Mean pleasantness ratings (converted to z-scores) for SSD-CI participants in the present study (within-octave intervals with F3 root note) and NH controls and amusics from Cousineau et al. (2012). In the top left panel, the present SSD-CI NH-only data are plotted alongside the NH control data from Cousineau et al. (2012). In the top right panel, the present SSD-CI CI-only data are plotted alongside the amusic data from Cousineau et al. (2012). In the bottom left panel, the present SSD-CI NH-only data are plotted alongside the present SSD-CI CI-only data. In the bottom right panel, the NH control data from Cousineau et al. (2012) are plotted alongside the amusic data from Cousineau et al. (2012).

