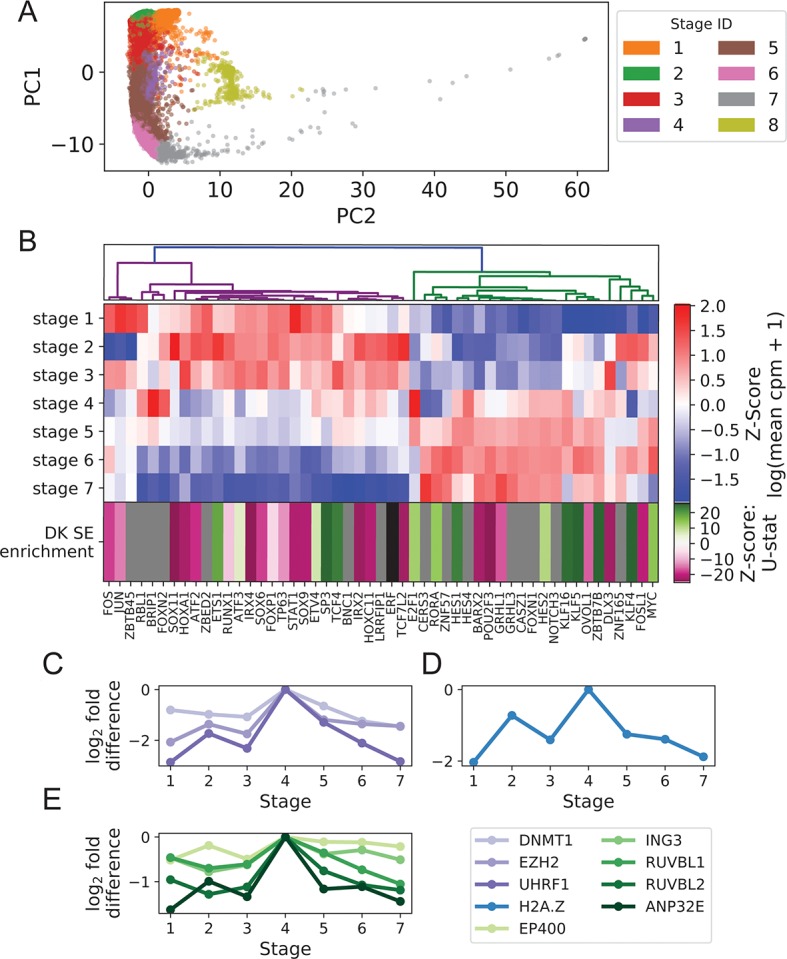
Figure 1.

Turnover in Keratinocyte TF expression is temporally and spatially coupled to turnover in SEs. (A) Imputed single-cell expression vectors of 22,338 foreskin keratinocytes projected onto first two principal components; stage membership was assigned by k-means–based approximate spectral clustering. (B) First seven rows show log-transformed stage-wise mean imputed expression of dynamic Keratinocyte TFs normalized across stages. Bottom row shows the magnitude and direction of differential motif enrichment between BK and DK SEs. Gray and black cells correspond to TFs without a known binding motif and TFs not differentially enriched between SE sets, respectively. Columns are organized by hierarchical clustering on first seven rows (Methods). (C−E) Log fold-change in stage-wise mean imputed expression between stage 4 (mitotic state) and other stages for established keratinocyte epigenetic regulators (C), H2A.Z (D), and a subset of components of SWR1 remodeler complex (E). See also Supplementary File 1: Figures S1−4 .
