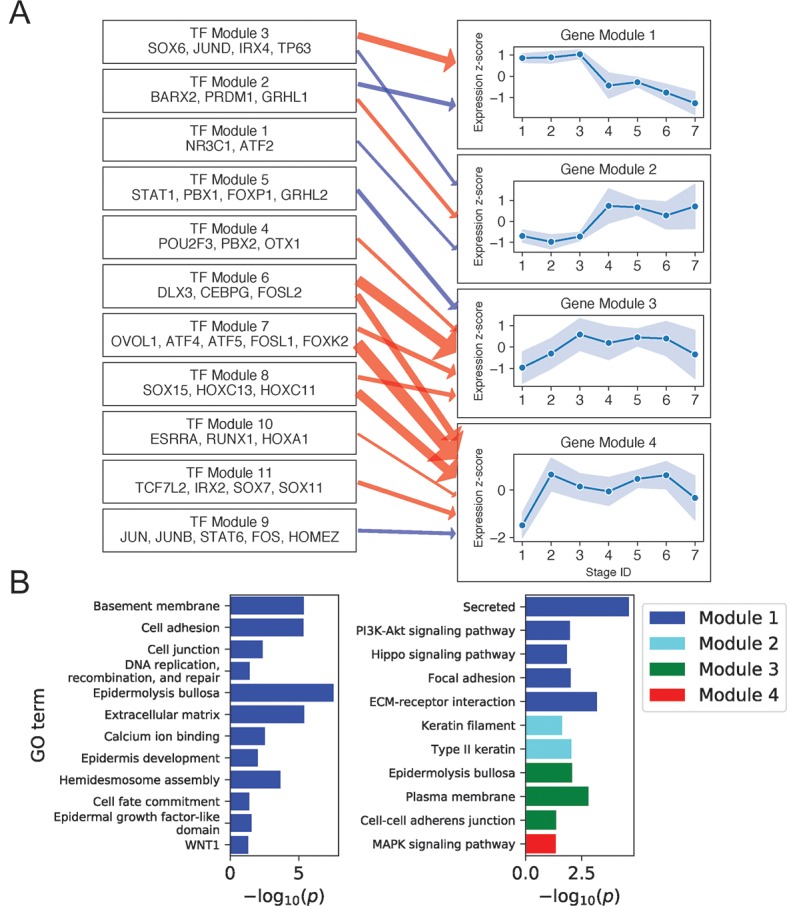
Figure 3.

Basal keratinocyte network analysis identifies gene and TF modules specific to basal functions. (A) Regulation of four GO-enriched gene modules by TF modules, represented as a directed graph. Gene module nodes show log-transformed stage-wise mean imputed expression normalized across stages 1 to 7 with shading of 1 standard deviation interval. Transcription factor modules list their TF constituents. Arrows indicate regulation with width proportional to predicted strength of activation (red) or inhibition (blue). (B) Minus log of adjusted p values for selected GO terms enriched in each gene module. See also Supplementary File 1: Figure S5 .
