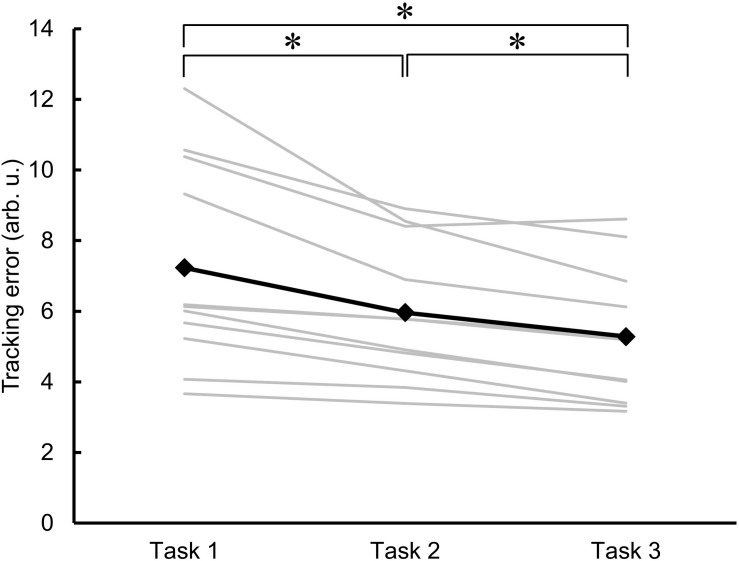
FIGURE 3.
Changes in motor performance. The errors in task performance during the skillful cycling session in Task 1, 2, and 3 are expressed as the area of error in arbitrary units (arb. u.). The gray lines represent individual participants. The black line and markers represent the mean data of all participants. One-factor repeated-measures ANOVA, N = 11, ∗P < 0.05.

