
Figure 6.
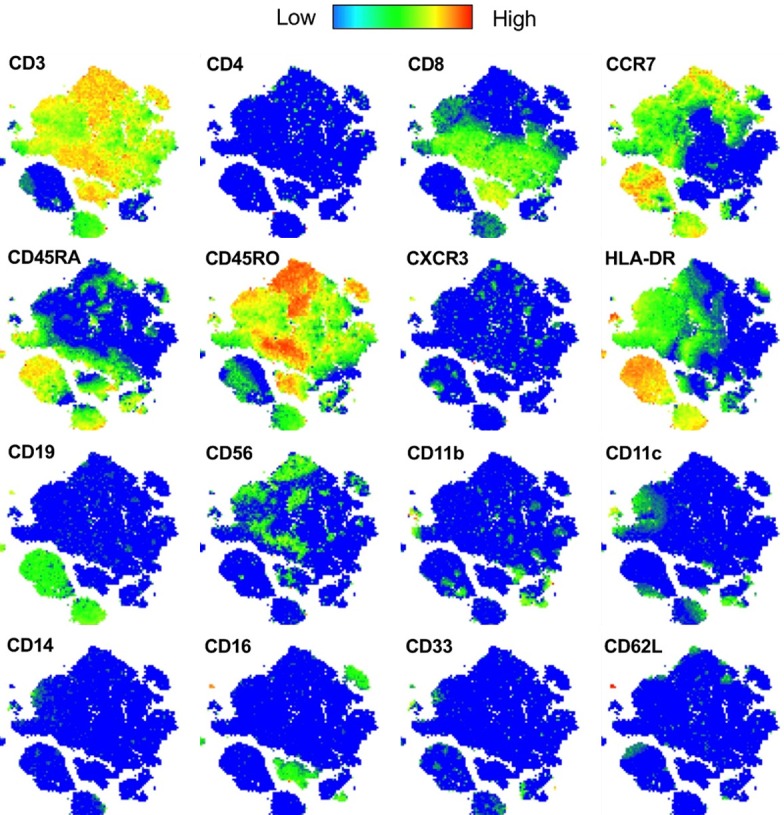
Human immune cell tSNE plot marker expression. tSNE plot generated from the prostate immune cells from 5 human patients. Heat maps of expression for each marker visualized using the Color Map Function.
Official websites use .gov
A
.gov website belongs to an official
government organization in the United States.
Secure .gov websites use HTTPS
A lock (
) or https:// means you've safely
connected to the .gov website. Share sensitive
information only on official, secure websites.
Human immune cell tSNE plot marker expression. tSNE plot generated from the prostate immune cells from 5 human patients. Heat maps of expression for each marker visualized using the Color Map Function.