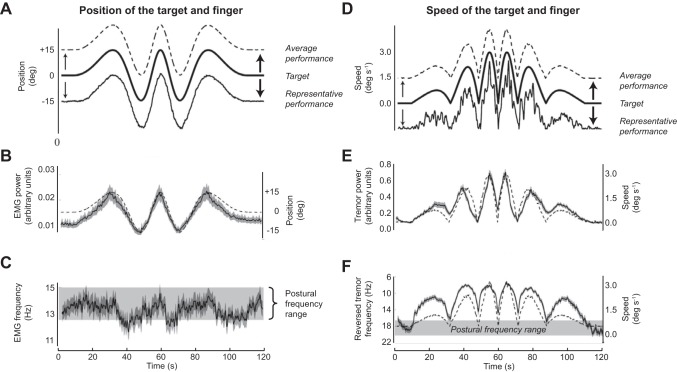
Fig. 4.
Participants use flexion/extension of the middle finger to track a target on a screen in a simple slow task. Upward movement of the finger (extension) is up. A: target position, finger position (representative subject), finger position (average, all subjects). B: rEMG of extensor muscle (means ± SD). C: peak frequency of rEMG spectrum (means ± SD). D: target speed, finger speed (representative subject), finger speed (average, all subjects). E: peak power of finger acceleration spectrum (means ± SD). F: peak frequency of finger acceleration spectrum. Note frequency scale is inverted (means ± SD). In B, the faint line shows average finger position, and in E and F it shows finger speed to emphasize how they correlate with the measured variables. In A and D, the traces are offset for clarity. [Modified from Vernooij et al. (88) under Creative Commons Attribution License 4.0.]

