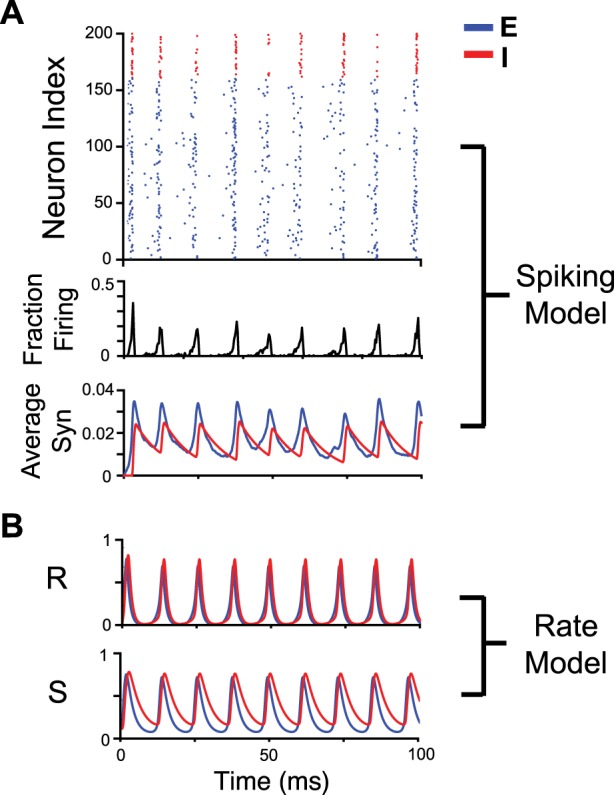
Fig. 1.

Stochastic spiking excitatory (E)-inhibitory (I) oscillatory model with fractional participation of neurons alongside time courses of the synaptic and rate variables of an E-I rate model. A, top: raster plot of 200 leaky integrate-and-fire neurons (160 excitatory and 40 inhibitory). The network received excitatory input from upstream Poisson spiking units. Bottom: histogram of spiking from all units and average synaptic activity averaged for excitatory and inhibitory populations. B: rate (r) and synaptic (s) dynamic variables from an E-I rate model with parameters tuned to match that of the spiking model. Note how the rate variable and spiking histogram demonstrates fractional participation of neurons for each cycle in the oscillation. Network rate exhibits more sharp peaks than synaptic activity for both rate and spiking models.
