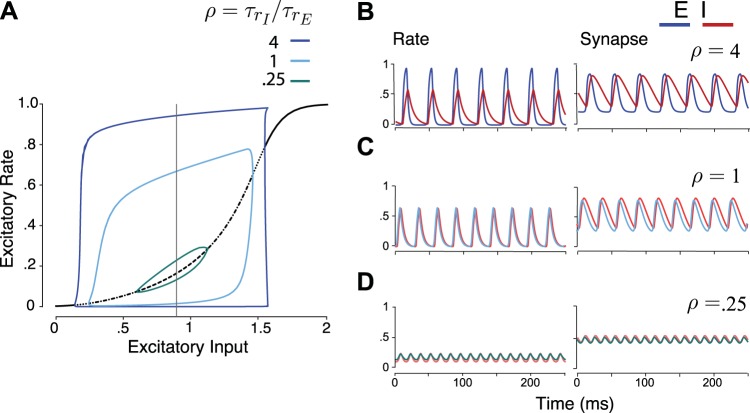
Fig. 2.
Bifurcation diagram and respective time courses of an excitatory (E)-inhibitory (I) rate model, for 3 values of the ratio of rate timescales for the E and I populations. A: bifurcation plots of the 4-variable E-I gamma model (Eqs. 1 and 2) showing the rate variable rE of the excitatory population vs. excitatory input, IE. Steady-state rate (black) is flanked by maximum and minimum amplitudes of oscillation. The steady state transitions from stable (solid) to unstable for different ratios of time constants, ; ρ = 0.25 (dotted), ρ = 1 (dot-dashed), ρ = 4 (dashed). Thin vertical black line corresponds to input value (IE = 0.9) for example time traces. Colors illustrate oscillation amplitude profiles for varying ρ. The time constant values are = 8 ms and = 2 ms (ρ = 0.25), = = 5 ms (ρ = 1), and = 2 ms and = 8 ms (ρ = 4) for the E and I rate variables with the synaptic timescales fixed to 3 ms (E) and 10 ms (I). The oscillation amplitude near onset changes more abruptly as ρ increases, i.e., the inhibitory rate timescale becomes larger than the excitatory rate timescale. B–D: example time courses for IE = 0.9 (thin vertical black line in A) for both rate and synapse variables. Oscillation becomes more PING-like as the ratio of inhibitory to excitatory rate timescales increases.

